


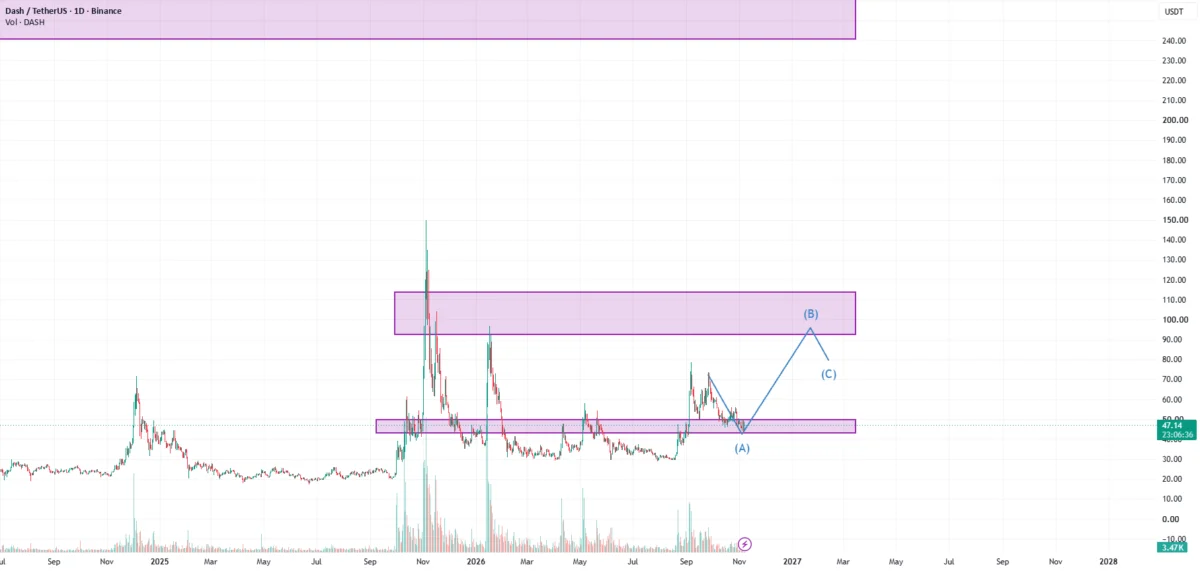
The most prominent feature of the current price action is a falling wedge pattern, a technical formation typically associated with bullish reversals. A closer examination of the price dynamics within this wedge reveals that the descending highs are dropping at a faster rate than the corresponding lows. Specifically, previous resistance checkpoints have shifted downward from 56 to 50, and most recently to 48.5. Meanwhile, the reaction lows have remained relatively contained, moving from 46 down to 45, and eventually touching 43.5. This narrowing price range indicates that selling momentum is steadily fading, as bears are finding it increasingly difficult to drive the asset to deeper depths with the same conviction as before.
Adding weight to the bullish reversal argument is a recent market event around the $43.5 price level, which analysts have identified as a classic "spring" or bear trap. During this movement, the price of DASH briefly swept below the established $43.5 to $45 support zone before experiencing a swift and aggressive recovery as buyers stepped in to absorb the available supply. This type of price action frequently flushes out leveraged or weak-handed retail participants who panic-sell near local lows, transferring control of the asset to stronger market hands just prior to a structural shift.
Furthermore, a potential inverse head and shoulders pattern appears to be forming on the charts, adding further credibility to the developing bullish thesis. In this configuration, the left shoulder is situated around the $45 mark, while the head is marked by the recent sweep down to $43.5. For the pattern to complete and receive validation, the right shoulder must hold firm within the $45 to $46 range. Market observers note that the neckline of this inverse head and shoulders pattern aligns closely with the upper boundary of the falling wedge, which is situated roughly between $48.5 and $50. A successful defense of the right shoulder region would set the stage for a test of this critical overhead resistance zone.
Underpinning these price patterns is a noticeable shift in market volume. Overall trading volume has been on a declining trajectory as the price compresses within the wedge, a phenomenon that traditionally signifies seller exhaustion. When volume dries up during a prolonged downtrend, it generally implies that the supply of willing sellers has been largely depleted, leaving the market vulnerable to a sharp upward repricing should buying interest return with sufficient force.
Despite these encouraging structural developments, market participants are exercising caution and waiting for definitive confirmation before altering their macroeconomic outlook on the asset. Analysts emphasize that the primary trend remains bearish until proven otherwise, and the current $44 to $50 range runs the risk of continuing a choppy, sideways consolidation pattern in the immediate future. Rather than attempting to front-run a potential breakout, traders are closely watching specific invalidation and confirmation levels to guide their exposure.
The primary trigger for a confirmed bullish continuation is a decisive daily market close above the $50 resistance threshold, ideally accompanied by a surge in trading volume to validate the breakout. If this condition is met, market projections point toward a measured target range between $54 and $56, which corresponds to the origin point of the falling wedge as well as a previous double top formation. Conversely, the critical line in the sand for the current bullish setup is a daily close below the $43.5 support level. Such an event would invalidate the inverse head and shoulders pattern and the falling wedge thesis, signaling a resumption of the broader downtrend and likely inviting renewed selling pressure.
As market participants continue to monitor the evolving charts, analysts reiterate that technical formations serve as probabilistic tools rather than guarantees. Comprehensive risk management remains paramount, particularly in volatile cryptocurrency markets where macro conditions can swiftly invalidate technical projections. For now, DASH sits at a critical technical crossroads, with traders poised to react once the asset breaks out of its current tightening range.

Comments (0)