


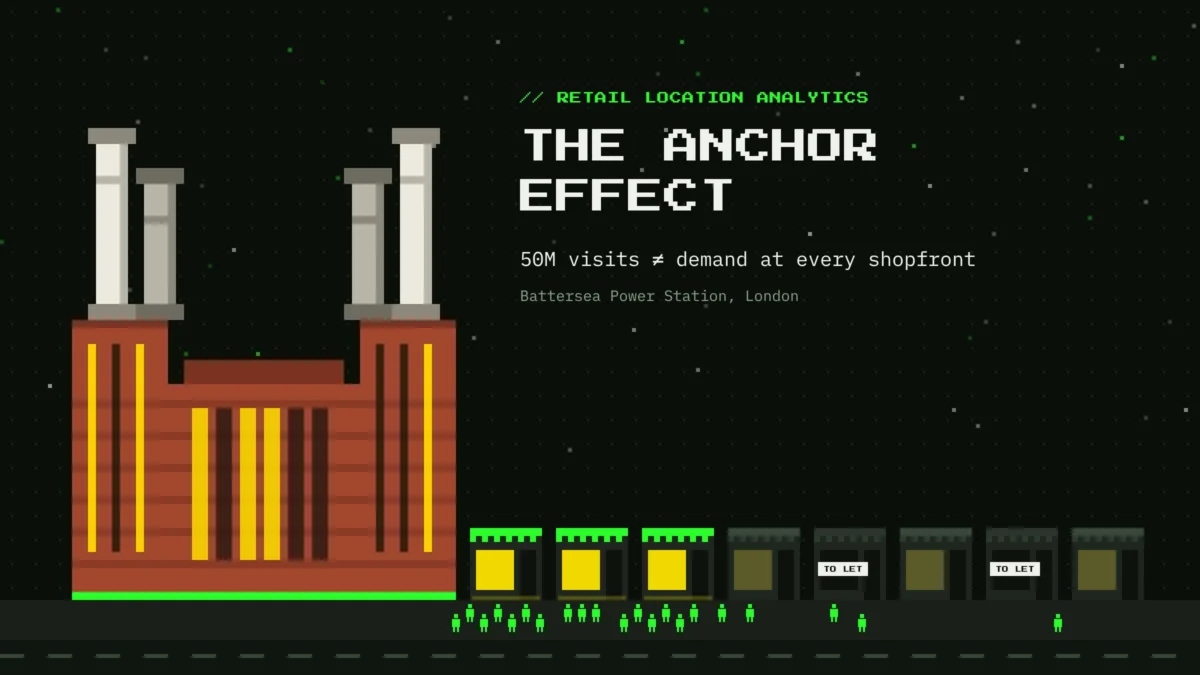
London’s iconic Battersea Power Station recently celebrated a major milestone, announcing that its restored landmark has welcomed 50 million visitors since opening its doors in October 2022. While the figure underscores the massive appeal of the riverside development as a premier London destination, retail analysts and urban planners point out a crucial distinction between destination traffic and actual storefront footfall. The headline-grabbing metric measures overall destination arrivals rather than unique visitors, individual consumer journeys, or direct purchasing intent. For retailers eyeing space within master-planned estates, understanding how broad destination appeal translates—or fails to translate—into commercial viability requires a far more granular look at spatial dynamics and store-level economics.
Recent municipal data highlights the stark contrast between high-level visitor milestones and micro-level retail performance across the development’s completed zones. According to the Wandsworth Council Town Centre Monitoring Report 2025, vacancy rates vary significantly across different parts of the Battersea estate. Based on a council survey conducted in autumn 2025, overall vacancy stood at 12 percent across 148 surveyed units in completed zones. However, a closer look reveals sharp spatial divergences. Arches Lane recorded a vacancy rate of 38 percent with five vacant units out of 13, while Electric Boulevard logged a 26 percent vacancy rate with five out of 19 units empty. In contrast, the high-traffic Turbine Hall reported a vacancy rate of just 7 percent across 100 units, and Circus Road West saw only one vacancy among its 16 units, representing a 6 percent rate.
While these municipal datasets provide a valuable snapshot of occupancy, they record the state of units rather than the underlying reasons for vacancies. Furthermore, because the council’s survey predates the developer’s September 2026 visitor milestone by nearly a year, the figures establish no direct statistical link between overall destination visits and unit-level occupancy. Retail analysts emphasize that unit vacancies are governed by a complex mix of variables, including rental prices, unit sizes, lease terms, and the costs associated with commercial fit-outs.
The core challenge for commercial tenants lies in bridging the gap between destination traffic and storefront exposure. A visitor arriving at a major landmark does not automatically traverse every pathway, notice every shopfront, step inside, or make a purchase. The journey from initial arrival to a completed transaction involves a distinct conceptual chain starting with destination arrivals, moving through pedestrian routes, translating into frontage exposure, leading to store entrances, and finally resulting in transactions. These stages are far from interchangeable. Destination visits do not equate to frontage footfall, and frontage footfall does not automatically convert into sales volume. A boutique tucked away on a secondary side street may experience a fraction of the pedestrian traffic seen by a storefront on a primary boulevard, even if both are situated equidistant from the local transport links.
Assessing the true potential of a retail location requires untangling three distinct spatial metrics that answer very different planning questions: proximity, accessibility, and exposure. Proximity is typically measured using a Euclidean buffer, such as a straight-line 300-metre radius from a transit hub. While this offers a quick geographical overview, it entirely ignores physical barriers such as railway infrastructure, intervening buildings, and inaccessible property entrances. Accessibility shifts the focus to a network isochrone, calculating the exact area reachable within a specific timeframe along official pedestrian pathways. A five-minute isochrone measures reachability rather than actual human movement, meaning both bustling commercial thoroughfares and quiet residential alleys can sit within the exact same time boundary.
Exposure, meanwhile, measures the actual pedestrian flow passing a specific shopfront and the physical opportunity for consumers to notice the display. This metric depends heavily on micro-factors such as route choices, entrance positioning, physical barriers, and natural sightlines. While digital network models and origin-destination algorithms can estimate pedestrian routes, determining true frontage flow requires observed manual counts or validated, privacy-compliant mobility data. Two separate retail units might both sit exactly 150 metres away from the nearest underground station, yet Unit A might enjoy direct visibility from the primary pedestrian thoroughfare leading to nearby corporate offices, while Unit B sits obscured around a corner. While their accessibility is identical, their pass-by exposure and resulting commercial opportunities diverge wildly.
Ultimately, high pedestrian flow holds no universal commercial value unless it aligns with a tenant’s specific business model, opening hours, and target demographic. To evaluate whether a location can sustain a business, analysts often model estimated revenue by multiplying catchment footfall by the frontage capture rate, the store entry rate, the purchase conversion rate, and the average transaction value. Connecting this estimated revenue directly to the occupier’s profit and loss statement involves calculating the Occupancy Cost Ratio, which compares total property costs—including rent and service charges—against store revenue. While this ratio does not measure total profitability, as gross margins, staffing costs, and other operational expenses still apply, it provides a vital link between the physical quality of a location and the financial burden required to secure it.
Different retail formats experience vastly different flow profiles and economic pressures. High-frequency convenience stores rely heavily on constant, daily pass-by traffic and rapid transactions, whereas destination dining establishments and experiential showrooms depend on planned visits and longer dwell times. Major anchor attractions can certainly generate complementary demand or retain spending within a district, but the ultimate benefit to surrounding merchants depends entirely on tenant categorization, natural pedestrian desire lines, and the degree of overlap between different commercial offerings.
Evaluating a retail site successfully requires moving beyond broad destination metrics and municipal occupancy summaries to focus on unit-level evidence. Public data sources—while essential for establishing baseline context—have clear limitations. Developer metrics highlight destination activity over time rather than movement patterns between specific zones or traffic at an individual storefront. Municipal council surveys track occupancy and commercial use types without capturing the reasons behind vacancies or underlying sales figures. Meanwhile, transport datasets from agencies like Transport for London help establish regional accessibility, but station-level passenger data cannot measure pedestrian movement along individual retail corridors.
As developments like Battersea Power Station continue to mature, assessing the true commercial potential of a retail space ultimately comes down to measuring the demand that actually reaches the door. By keeping proximity, accessibility, and exposure distinct, and by rigorously connecting spatial evidence to observed movement and store-level economics, stakeholders can look past headline visitor milestones to accurately assess the realities of retail real estate.




Comments (0)