


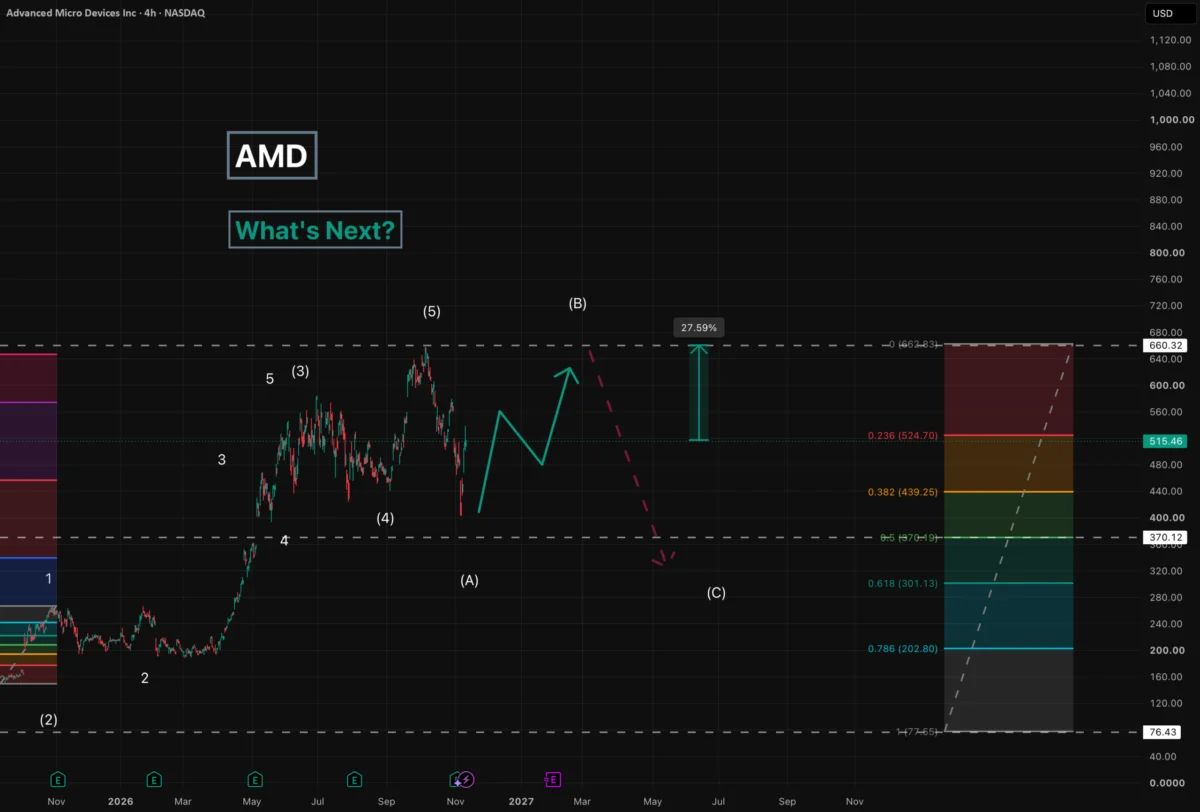
As market participants continue to scrutinize the shifting dynamics of the technology sector, technical analysts are turning their attention toward Advanced Micro Devices, commonly known as AMD. Recent chart evaluations suggest that the semiconductor giant may be positioning itself for a significant corrective phase, one that could offer a considerable upside opportunity before broader bearish pressures resume. Observers closely monitoring the equity markets have begun mapping out the trajectory of the stock using classic Elliott Wave principles, providing a clearer picture of where the security stands following its latest impulsive movements.
Where Are We Now in the Market Cycle?
To understand the current positioning of Advanced Micro Devices, market analysts break down the recent price action into distinct wave formations. The evaluation indicates that the equity has recently completed a comprehensive five-wave move to the upside. In traditional technical analysis, a five-wave advance typically signals the conclusion of a primary bullish impulse cycle, after which the market naturally transitions into a corrective period to digest previous gains.
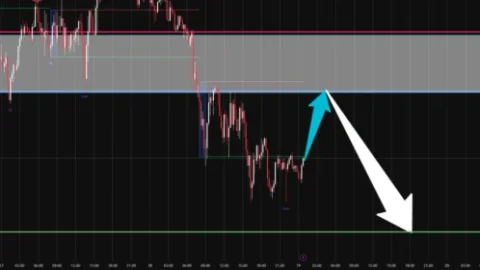
Following the completion of that five-wave upward trajectory, the stock entered a corrective phase known as Wave A. This initial downward adjustment tested market resilience and established a foundation for the subsequent moves currently unfolding on the charts. At present, technical positioning suggests that Advanced Micro Devices is actively navigating through Wave B of this broader corrective sequence.
Within the framework of Elliott Wave theory, Wave B generally represents a counter-trend bounce or a retracement within a larger correction. In this particular scenario, the analysis outlines a notably optimistic outlook for the equity’s near-term performance. Under the most favorable conditions mapped out by market technicians, the price of Advanced Micro Devices could extend its recovery and retrace all the way back to the key target level of $660.
Reaching this specific price milestone would represent a notable percentage gain from current trading levels. Based on the current valuation of the security, achieving this objective would translate to a potential upside of approximately 27%. Such a move would provide substantial room for recovery for market participants who navigated the preceding downward adjustment of Wave A.
Looking Beyond the Current Recovery Phase
While the prospect of a 27% upward retracement offers an encouraging outlook for near-term positioning, technical strategists emphasize that this phase is likely part of a larger, more complex market structure. Once the current corrective sequence—including the anticipated completion of Wave B—fully runs its course, the broader market dynamics suggest that the equity could eventually see another move to the downside.
This subsequent downward phase would align with the traditional expectation of completing the larger corrective pattern before the stock attempts to establish a sustained long-term trend. However, detailed projections regarding this potential subsequent leg downward remain a subject for future market updates as price action unfolds and provides additional confirmation on the charts.
Interestingly, analysts observing these developments note that the technical setup currently visible on the Advanced Micro Devices chart shares striking structural similarities with charts from other major technology leaders, notably Alphabet Inc., trading under the ticker GOOGL. This parallel suggests that broader macroeconomic sentiments and sector-wide technical patterns continue to exert a harmonizing influence across major large-cap technology equities, even as individual stocks navigate their own unique wave counts and price milestones.
As market participants weigh these technical projections, discussions continue to circulate across financial platforms and trading communities regarding the validity of these targets and the timing of the anticipated waves. While some observers share the optimistic view pointing toward the $660 target, others maintain alternative perspectives on how the semiconductor manufacturer’s stock will perform in the sessions ahead.
Disclaimer
The information and publications discussed in this technical market update are not meant to be, and do not constitute, financial, investment, trading, or other types of advice or recommendations supplied or endorsed by financial platforms or market tracking services. Market participants are always encouraged to conduct their own comprehensive research and risk assessments before engaging in any financial or trading activities, keeping in mind the inherent volatility and risks associated with equity markets.

Comments (0)