


Hello Community, and welcome to my new market analysis focusing on enterprise
artificial intelligence software provider C3.ai from a weekly timeframe perspective. In my recent market breakdowns, I detailed how the broader artificial intelligence stock market experienced a major bearish turn to the downside, evaporating a significant amount of value across various AI-focused equity holdings. This severe market correction has already led to notable casualties, including the second bearish fallout of the Situational Awareness fund. Within this fund, a substantial portion of the holdings has been severely impacted, blowing up in direct alignment with the aggressive bearish declines witnessed across a wide array of high-flying AI stocks.
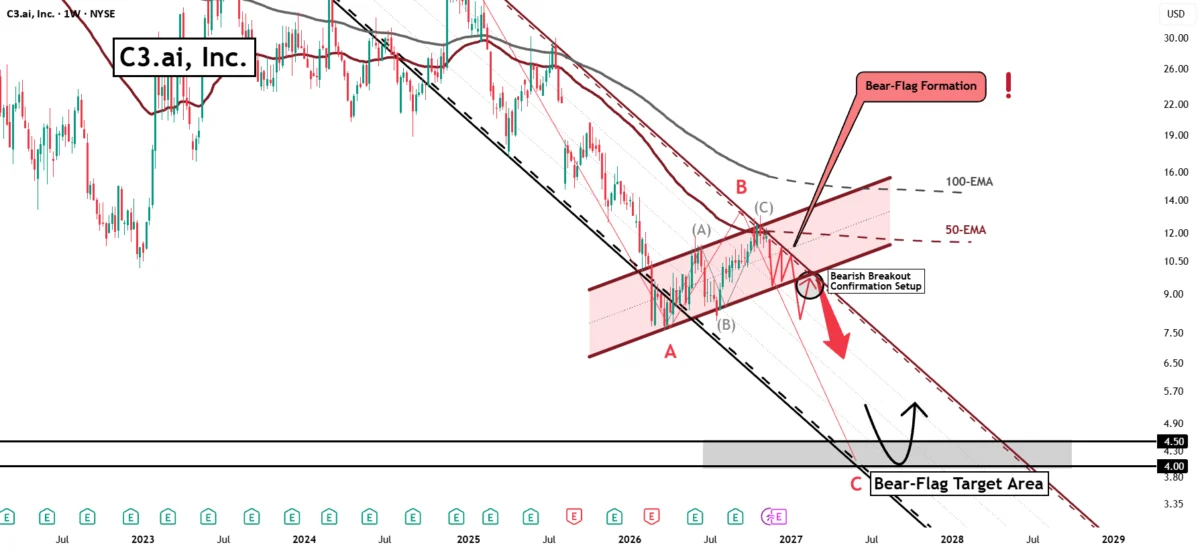
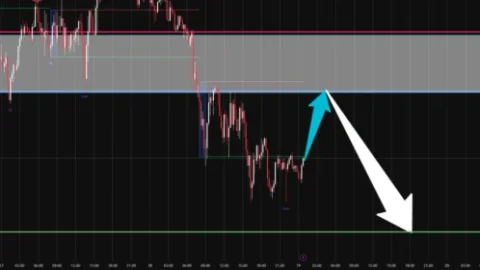
Now, turning our attention specifically to C3.ai, my latest technical evaluation reveals that the stock is actively forming the next major bearish continuation pattern: a gigantic bear-flag formation. This classic technical pattern is effectively priming the price action for a sustained move to the downside, setting the stage for what could develop into the next major bearish wave carrying the stock toward significantly lower price levels. At the current juncture, C3.ai is already displaying clear signs of pulling back directly off the 50-period Exponential Moving Average (EMA). This rejection and subsequent downward movement are successfully laying the technical groundwork for the next leg of selling pressure toward lower support targets.
The technical implications of this setup are becoming increasingly difficult for market participants to ignore. A definitive, confirmed breakout below the lower boundary of the prevailing bear-flag formation will formally activate the lower target zones mapped out in my accompanying chart. Once this technical setup has been fully triggered and validated by market volume, it is highly probable that another aggressive wave of bearish pressure will rapidly unfold, significantly expanding the overall downward potential of the stock. In any event, the broader bearish market perspective should not be underestimated under any circumstances, especially as a confluence of additional macroeconomic and sector-specific trigger events could easily lead to a cascade of accelerated selling pressure across the board.
In this manner, thank you a lot for watching and engaging with this analysis, and please know that your ongoing support is highly appreciated as we navigate these volatile market conditions together.
VP
Disclaimer
The information and publications provided herein are not meant to be, and do not constitute, financial, investment, trading, or other types of advice or recommendations supplied or endorsed by TradingView. Readers are encouraged to read more in the Terms of Use regarding policies on investment decisions and trading risks.

Comments (0)