


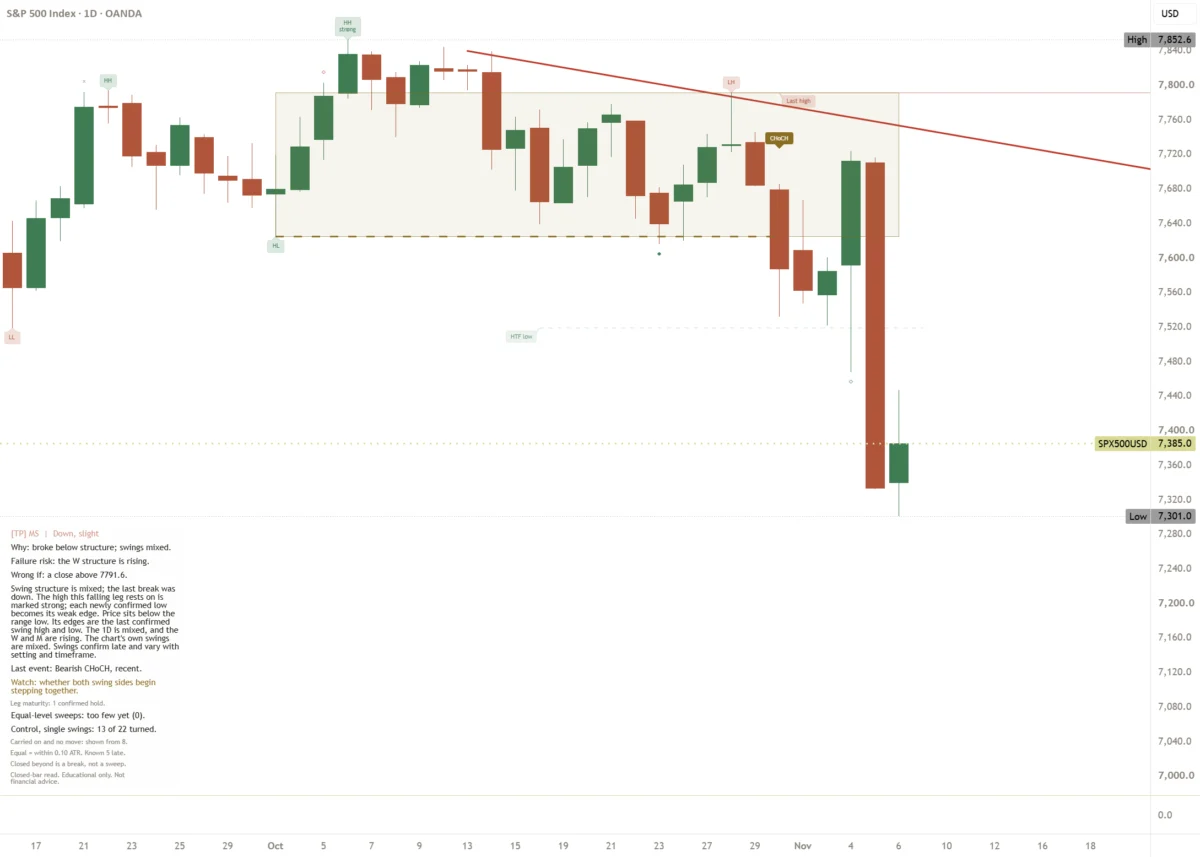
The S&P 500 experienced a punishing week of trading, surrendering 2.7 percent in a swift correction that largely materialized over the course of just two sessions. The benchmark index, which closed the previous week at 7,587.20, faced intense selling pressure that culminated in a steep drop on Thursday, wiping out substantial value before finding a tentative foothold near the end of the week. As the closing bell rang on Friday, the index settled at 7,385.00, leaving market participants to reassess the near-term trajectory of equities amid a shifting technical landscape and looming macroeconomic catalysts.
The downward momentum developed rapidly mid-week. Earlier, the S&P 500 had reached a weekly high of 7,723.90 on Wednesday, offering a brief moment of optimism for bulls before sellers stepped in aggressively. The vast majority of the week’s losses were concentrated in a brutal 48-hour window. Most notably, Thursday’s session witnessed a dramatic descent, with the index plunging from an opening level near 7,712.00 down to 7,334.00. The sell-off extended into Friday, driving the index down to a weekly low of 7,301.00 before a modest bounce brought it back to its final closing mark of 7,385.00.
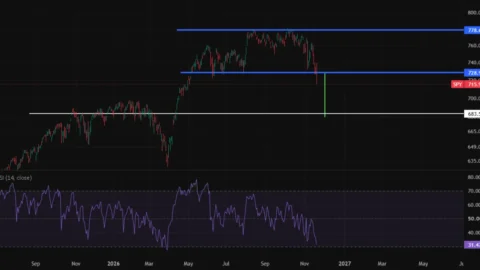
This sharp contraction sliced through critical support levels that had previously underpinned the market structure. Specifically, the swing low established earlier in the month on Tuesday, November 3, at 7,522.00, was decisively breached, removing a major technical floor. With that key level now converted into resistance, market participants are keeping a nervous eye on the July low, which sits precariously at 7,299.60—just beneath Friday’s intraday low point.
From a technical perspective, the broader chart structure has visibly deteriorated. A descending trendline can be mapped by connecting the October 14 high of 7,839.60 with the subsequent high of 7,791.60 recorded on October 28. This falling barrier tracks near 7,750.00 as trading resumes on Monday. A closer examination of recent price action reveals a clear pattern of lower highs—stepping down from 7,839.60 to 7,791.60, and subsequently to 7,723.90. Because the latest structural break resolved to the downside, the overarching technical read for the index is currently negative, albeit characterized by a slight bias rather than an unmitigated panic. Chart technicians note that this bearish bias would be invalidated only upon a decisive daily close above the 7,791.60 threshold.
Attention across global financial markets is now pivoting firmly toward Washington and the upcoming release of the United States Consumer Price Index (CPI) for October. Scheduled for publication on Tuesday, November 10, at 13:30 UTC, the inflation report arrives at a particularly sensitive juncture for asset prices. With the S&P 500 already battered by recent selling and interest rates remaining at elevated levels, the macroeconomic data point carries significant volatility risk. Market strategists emphasize that whether the inflation print comes in hotter than anticipated or softer than expected, the reaction across equities is likely to be swift and pronounced as algorithms and institutional investors reprice risk.

Against this backdrop of heightened uncertainty and looming macroeconomic data, market analysts are mapping out three distinct scenarios for how the index might behave in the immediate term.
The most probable path in the eyes of market observers is a period of sideways consolidation. This scenario would involve daily closes hovering within a relatively contained range between the Friday low of 7,301.00 and the former support-turned-resistance level at 7,522.00. While the market undergoes this choppy consolidation, seasoned traders suggest that patience is paramount, with the 7,522.00 level serving as the primary benchmark to watch on any potential upside attempts.
A more bearish continuation represents a less likely, though entirely plausible, outcome. Under this scenario, the index would record a daily close beneath the crucial 7,301.00 threshold. Should that technical barrier fail to hold, market participants would immediately turn their attention toward the June low of 7,229.20 as the next major area of interest.
Finally, a market recovery is currently viewed as the least likely trajectory for the immediate aftermath of the data release. For a genuine recovery to take shape, the index would need to secure a daily close back above 7,522.00, followed by a subsequent push past the week’s high of 7,723.90. Even in the event of a strong rebound, the descending trendline near 7,750.00 and the horizontal resistance at 7,791.60 would represent formidable hurdles for buyers to clear.
Until the market demonstrates a definitive break from its current range or provides a clear reaction to the incoming inflation data, market participants are generally adopting a disciplined stance of letting prices come to key levels rather than forcing trades in the middle of the range.

Comments (0)