


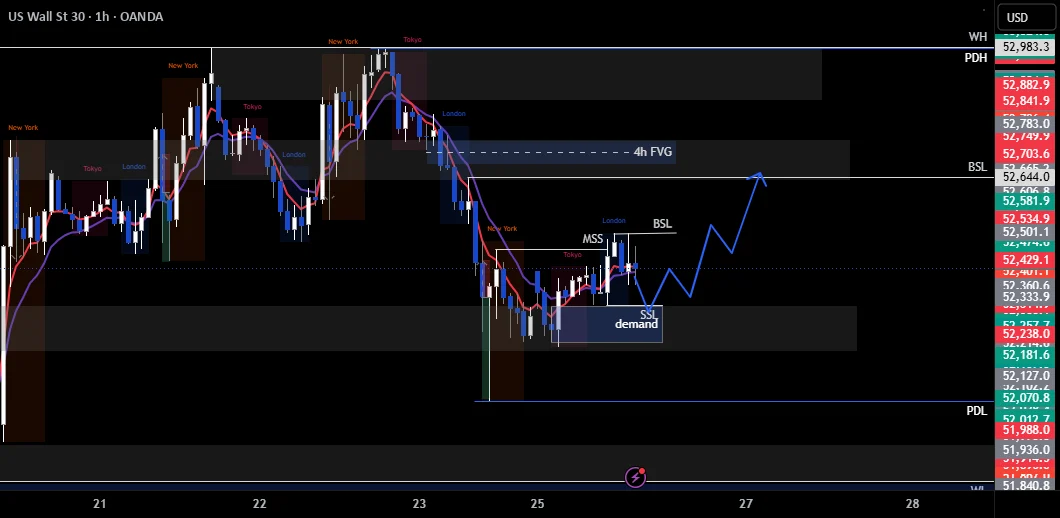
Market participants and index traders closely monitoring the US Wall St 30 index are currently navigating a complex technical landscape, characterized by conflicting signals across multiple timeframes. According to a market update published by financial analyst Indicesforlife on TradingView, the broader price action for the US30 index remains fundamentally bearish when evaluated on the four-hour chart. However, a localized shift toward a bullish structure has emerged on the one-hour timeframe, prompting traders to reevaluate their immediate setups and identify potential liquidity pools before committing to new positions.
The technical dynamic highlighted in the analysis points to a classic multi-timeframe divergence scenario, which frequently occurs during market transitions or corrective pullbacks within a larger macro trend. On the four-hour chart, the US30 continues to reflect overarching selling pressure, suggesting that the path of least resistance over the medium term leans toward the downside. For swing traders and macro-oriented participants, this broader bearish structure serves as the primary backdrop for the index, keeping caution at the forefront for anyone considering aggressive long positions.
Yet, day traders and short-term market participants operating on lower timeframes are paying closer attention to the shifting momentum observed on the one-hour chart. This recent structural shift to the bullish side indicates that intraday buyers have managed to step in, creating a temporary counter-trend rally or a potential reversal phase depending on how upcoming price action unfolds around key liquidity zones. Such shifts often create fertile ground for intraday opportunities, provided that traders wait for confirmation rather than chasing early moves in isolation.

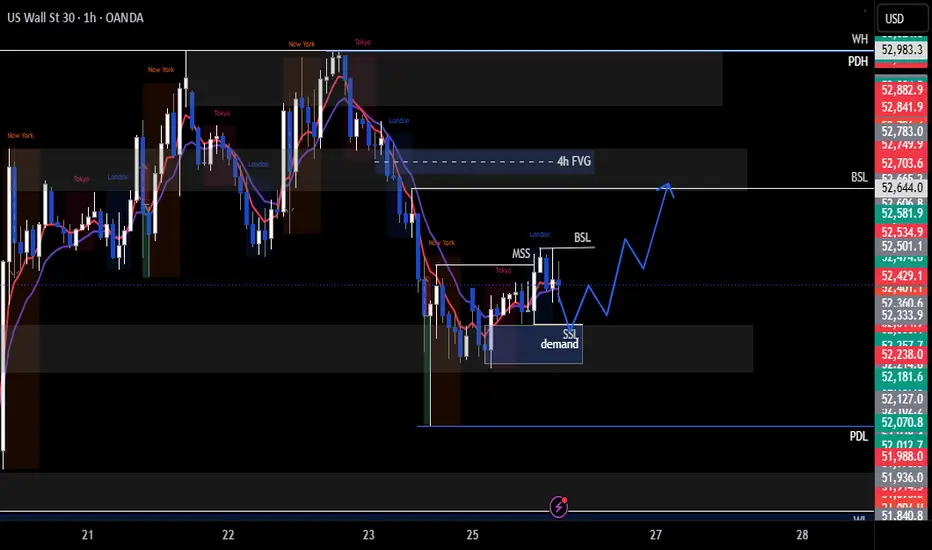
To bridge the gap between the dominant four-hour bearish trend and the emerging one-hour bullish shift, the analysis outlines a specific execution framework centered on liquidity sweeps and demand zones. Specifically, market watchers are advised to monitor the lows established during the London trading session. In institutional and retail technical analysis alike, session lows and highs are frequently targeted by market makers to capture resting liquidity—such as stop-loss orders from early breakout traders or participants trapped on the wrong side of a move—before the market makes its true directional push.
The proposed approach involves watching for a sweep of these London lows, which would clear out weak-hand positions and potentially trap aggressive sellers. Following this anticipated liquidity sweep, the next critical step in the setup is a tap into a recognized demand zone—an area on the chart where institutional buying interest was previously concentrated and where unfilled limit orders may still reside. This confluence of a liquidity sweep followed by a reaction at a demand zone is a widely utilized methodology among price action traders seeking high-probability entry points.
Once the price interacts with these predefined levels, the analysis emphasizes the importance of drilling down to even lower timeframes, specifically the one-minute to five-minute charts. Within these micro-timeframes, traders look for internal structural shifts—such as a change of character or a break of structure to the upside—confirming that buyers have officially taken control of the immediate order flow. This multi-layered confirmation process is designed to ensure that traders are not entering positions prematurely while the broader four-hour bearish trend still holds sway overhead.
Should these lower-timeframe bullish structures materialize following the sweep of the London lows and the tap into demand, the projected trajectory targets a return toward the London highs. Beyond those immediate intraday hurdles, the analysis points toward higher buy-side liquidity targets, commonly referred to in technical vernacular as BSL. These higher buy-side liquidity pools represent resting stop orders sitting above previous swing highs, which institutional algorithms and trend-following participants often target as the market seeks expansion phases.
The discussion surrounding the US30 setup touches upon several key concepts frequently analyzed by technical traders, including chart patterns, comprehensive trend analysis, and specific index dynamics. The US Wall St 30, which tracks thirty prominent blue-chip companies listed on United States stock exchanges, often experiences sharp intraday volatility influenced by macroeconomic data releases, corporate earnings reports, and broader shifts in investor sentiment. As a result, traders focusing on US30 analysis, ideas, and long-term or short-term setups must remain adaptable to changing conditions across overlapping trading sessions, from Asia to London and into the New York opening bell.
As is standard practice across major financial publishing and charting platforms, the insights and publications shared by analysts such as Indicesforlife are intended strictly for informational and educational purposes. They do not constitute formal financial, investment, trading, or other types of advice or recommendations supplied or endorsed by platform operators or affiliated entities. Market participants are consistently encouraged to conduct their own thorough research, apply robust risk management principles, and consult with qualified financial professionals before executing any trades or altering their investment portfolios in response to dynamic market developments.

Comments (0)