


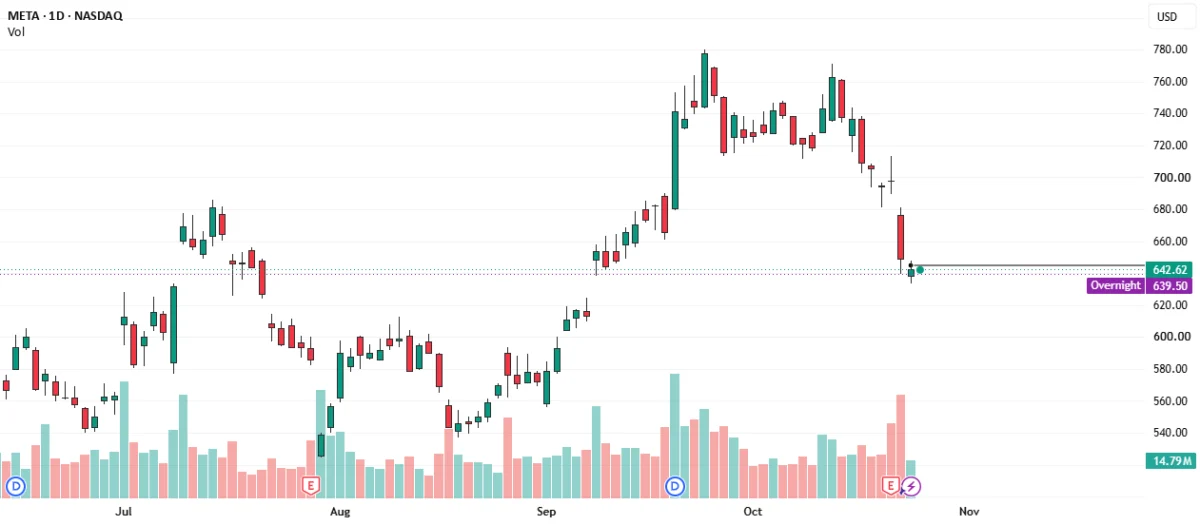
In the fast-paced world of equity trading, market participants are constantly evaluating price action, technical indicators, and fundamental metrics to identify high-probability setups among major technology stocks. Meta Platforms Inc. (NASDAQ: META) has recently drawn significant attention from traders following a powerful market move that outpaced even high-flying semiconductor giants like NVIDIA (NVDA). Amid recent earnings reports that yielded mixed reactions across Wall Street, traders are closely scrutinizing META’s charts to determine whether the current technical landscape points toward a meaningful trend reversal or signals further volatility ahead.
The recent trade setup on META began to take shape after the equity demonstrated a robust directional move, displaying a level of momentum that caught the eye of market observers. As the price pushed decisively outside of its Bollinger Bands (BB)—a popular volatility indicator used by technical analysts to gauge overextended market conditions—analysts began scanning the charts for crucial support zones. A closer inspection of the daily timeframe reveals an intriguing technical configuration: while the current price is trading below the shorter-term 10-period, 20-period, and 50-period simple moving averages (SMAs), it is currently holding near the 200-period SMA, which is functioning as a solid and reliable support level.
This interaction with the 200-period SMA occurs against the backdrop of broader technical developments that have been unfolding over the course of the year. Following a mild downtrend earlier in the reporting period, the 50-period and 200-period simple moving averages crossed paths to form what is widely recognized in technical analysis as a "golden cross." This classic chart pattern—formed when a shorter-term moving average crosses above a longer-term moving average—is historically viewed by market participants as a significant indicator of a potential shift in market momentum and a longer-term trend reversal. For many traders, the formation of this pattern on META serves as a compelling signal that the underlying trend could eventually pivot, allowing the ticker to resume an upward trajectory over time.
Of course, technical configurations do not exist in a vacuum, and fundamental factors continue to play a critical role in shaping market sentiment around Meta Platforms. The company’s recent earnings report presented a nuanced picture for investors. While the headline figures did not quite meet the consensus expectations of Wall Street analysts, the underlying financial reports highlighted continued top-line growth, with overall revenue registering an increase. For long-term investors and growth-oriented market participants, this revenue expansion reinforces the view that the underlying business remains robust, even as short-term earnings volatility weighs on immediate price action. Consequently, despite the recent earnings miss, many market observers remain convinced that the company retains significant long-term potential, driven by its core digital advertising ecosystem and ongoing investments in future technologies.
Looking ahead, market participants are also weighing alternative scenarios should broader market volatility or sector-specific pressures trigger a sharp downward move in META shares. In the event of a severe pullback, traders are keeping a close watch on the weekly timeframe for a significant push of the price well outside the weekly Bollinger Bands. Such an aggressive downward extension could theoretically drive the equity down toward the 200-period SMA on the weekly chart, or potentially even lower. While acknowledging that such a steep decline would represent an aggressive bearish push, market analysts note that extreme price excursions of this nature can occasionally present unique accumulation opportunities for those with a high risk tolerance and a multi-year investment horizon. As the market digests the interplay between shifting moving averages, revenue growth, and earnings expectations, META remains one of the most closely watched equities in the technology sector.
Disclaimer
The information and publications are not meant to be, and do not constitute, financial, investment, trading, or other types of advice or recommendations supplied or endorsed by TradingView. Read more in the Terms of Use.

Comments (0)