


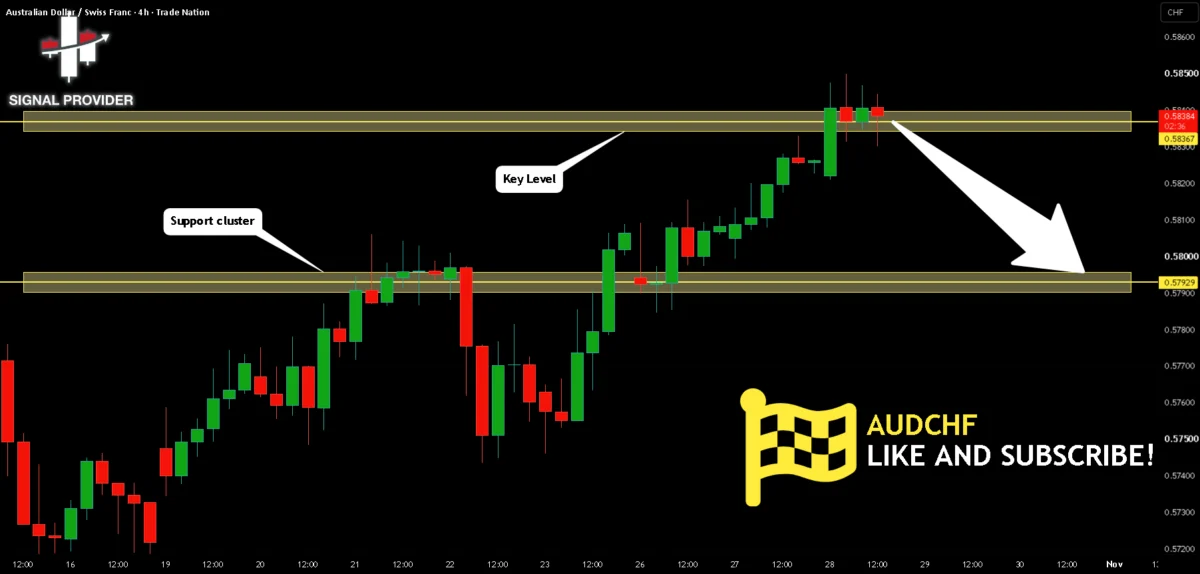
Financial markets across the globe are constantly evaluating macroeconomic shifts, currency valuations, and technical thresholds that dictate the near-term trajectory of major and cross-rate currency pairs. In the foreign exchange market, traders closely monitor structural interactions between key economies, particularly when technical indicators align to signal potential directional moves. Recent technical analysis focusing on the Australian Dollar against the Swiss Franc (AUDCHF) highlights a compelling setup for market participants tracking intermediate time frames, as bearish momentum encounters a significant horizontal barrier.
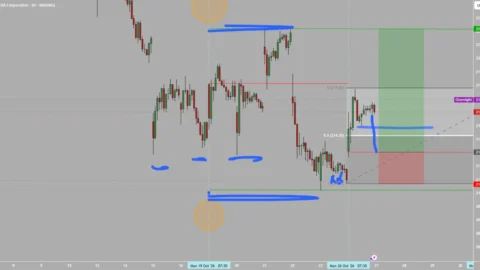
The 4-hour time frame analysis reveals a firmly established bearish trend governing the currency pair. In technical analysis, the 4-hour chart is frequently utilized by swing traders and intermediate market participants to capture multi-day trends without getting subjected to the excessive market noise often found on lower time frames such as the 1-minute or 5-minute charts. Within this specific horizon, the prevailing bias remains tilted to the downside, reflecting ongoing selling pressure and a consistent pattern of lower highs and lower lows characteristic of a healthy, functioning downtrend in currency markets.
Adding weight to the bearish outlook is the current market sentiment derived from momentum oscillators, specifically the 7-period Relative Strength Index (RSI). The RSI is a widely utilized momentum indicator that measures the speed and change of price movements on a scale from zero to one hundred. By evaluating a shorter lookback window of seven periods, the indicator becomes more sensitive to recent price fluctuations, making it particularly effective for identifying short-term overextended market conditions. According to the analysis, the 7-period RSI has signaled an overbought market state for AUDCHF.
To properly contextualize this reading within professional trading discourse, market definitions clarify the mechanics behind these conditions. Overbought refers to market scenarios where an instrument has traded considerably higher than its fair value, often driven by transient market sentiments, shifts in risk appetite, or positive news flow that creates temporary enthusiasm among buyers. Conversely, the term oversold refers to a condition where an asset has traded lower in price and subsequently possesses the potential for a price bounce or corrective recovery as sellers exhaust their immediate momentum. In the case of AUDCHF, the overbought signal on the short-term RSI, occurring within the context of a broader bearish trend, suggests that the recent upward retracement or stabilization may have run its course, setting the stage for sellers to reassert control.

Price action currently sees the market trading around a solid horizontal structure located at the 0.583 level. In technical analysis, horizontal structures act as critical psychological and historical reference points where buyers and sellers have previously interacted intensely. These levels often function as resistance during downtrends, as former support zones or congestion areas frequently flip roles once broken, turning into formidable barriers that inhibit upward price progression. The intersection of the current price action with the 0.583 horizontal structure provides a focal point for market participants evaluating risk-to-reward ratios for short positions.
Based on these converging technical observations—comprising the prevailing 4-hour bearish trend, the overbought reading on the 7-period RSI, and the interaction with the solid horizontal structure at 0.583—the market setup points toward a continuation of the primary downward trajectory. Analysts tracking this setup suggest that the market will inevitably achieve the 0.583-to-0.579 downward continuation, targeting the 0.579 level as the next logical technical objective where support may once again be tested.
As market dynamics continue to unfold across global currency exchanges, traders and analysts are reminded that technical evaluations provide probabilities rather than certainties, requiring rigorous risk management strategies. Those following the AUDCHF pair will be watching how price action reacts around the current horizontal barrier and whether momentum indicators confirm the anticipated descent toward the 0.579 target area in subsequent trading sessions.
Disclaimer: The information and publications provided in this technical review are not meant to be, and do not constitute, financial, investment, trading, or other types of advice or recommendations supplied or endorsed by TradingView. Market participants should conduct their own thorough research and risk assessment before executing any financial transactions.

Comments (0)