


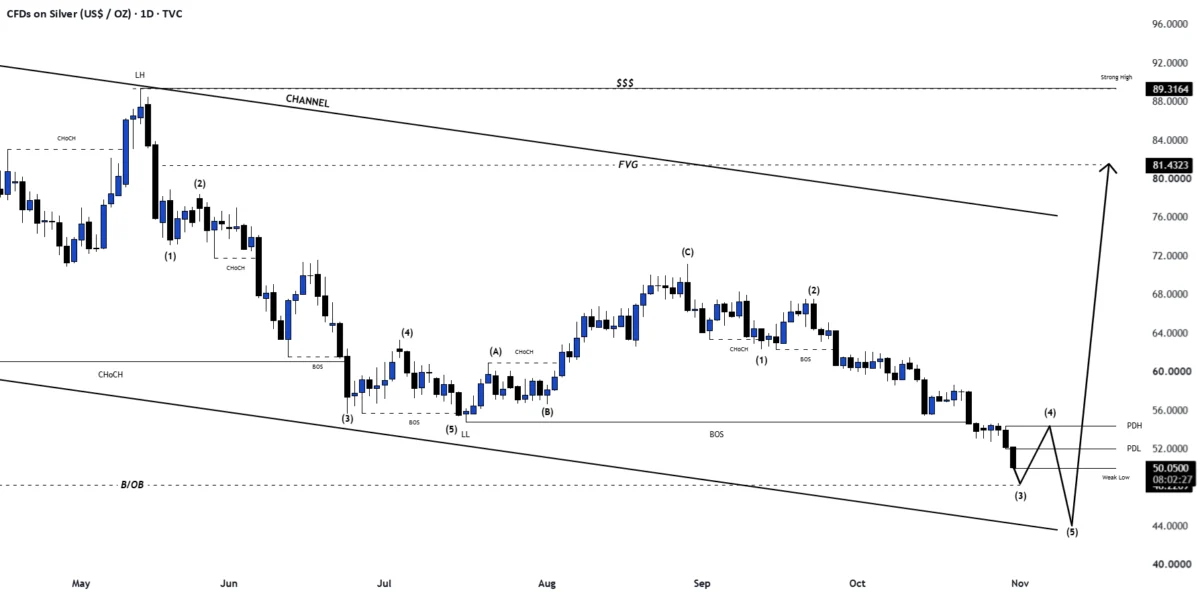
Financial markets are closely monitoring precious metals this week as fresh technical insights emerge regarding the price action of silver against the US dollar. Analyst commentary published by market observer ForexDetective highlights a confluence of classic technical indicators on the XAG/USD chart, suggesting that the precious metal may be navigating a significant corrective phase on higher timeframes. The analysis delves into structural price shifts, wave theory completions, and underlying market liquidity, offering traders and investors a detailed breakdown of the current technical landscape surrounding silver contracts.
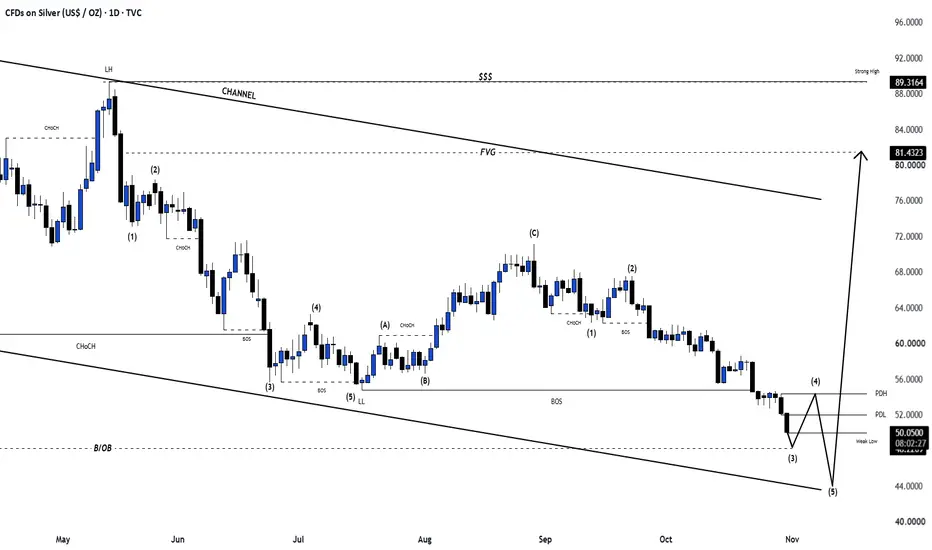
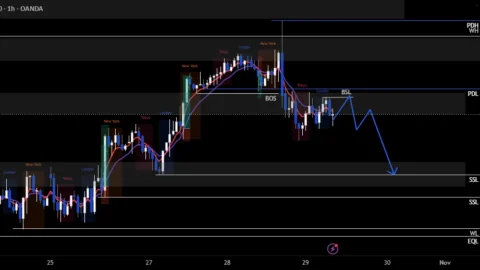
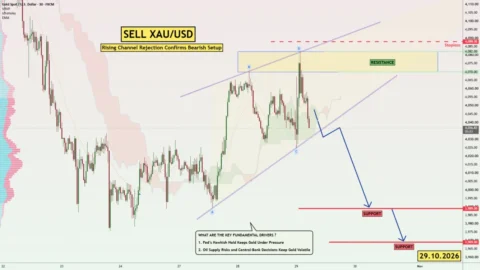
At the core of the recent technical evaluation is the identification of a bearish channel acting as a corrective pattern on higher timeframes. In technical analysis, a channel of this nature typically develops when an asset experiences a retracement against the prevailing long-term trend, or as a consolidation phase following a strong directional move. For silver, which has experienced notable volatility and shifting macroeconomic drivers throughout the year, the presence of a well-defined bearish channel indicates that sellers maintain a degree of control over intermediate price action, even as broader market debates continue regarding inflation hedges, industrial demand, and monetary policy trajectories.
Adding weight to the bearish assessment is the observation of a break of structure within the price data. A break of structure occurs when an asset moves past a significant previous swing high or low, signaling a potential shift in market sentiment or the continuation of a nascent trend. In the context of the XAG/USD chart, this structural break aligns with the broader corrective movement outlined by the channel, reinforcing the notion that market momentum has favored downward pressure over the near-to-intermediate term. Traders often monitor these structural pivot points closely to gauge whether support levels will hold or give way to deeper retracements.

The technical breakdown also incorporates principles of wave analysis, specifically noting the completion of twelve impulsive waves. In advanced charting frameworks, impulsive waves dictate the direction of the primary trend, whereas corrective waves move against it. The completion of a specific sequence of impulsive waves often serves as a warning sign to market participants that a cycle may be maturing, paving the way for a more substantial counter-trend movement or extended consolidation. By highlighting the fulfillment of this twelve-wave count, the analysis suggests that silver may have exhausted a particular phase of its directional momentum, leaving room for the current corrective patterns to dictate market behavior.
Beyond traditional chart patterns and wave counts, the evaluation draws attention to micro-market structure elements such as sell-side liquidity and fair value gaps. In modern algorithmic and institutional trading environments, sell-side liquidity often accumulates below established lows, representing resting stop-loss orders and breakout entries for short sellers. Market makers and institutional participants frequently target these liquidity pools before initiating subsequent directional moves. The identification of such liquidity zones on the silver chart implies that prices could gravitate toward these areas as the market seeks equilibrium.
Concurrently, the mention of a fair value gap points to pricing imbalances left behind during rapid impulsive moves. Fair value gaps occur when price action moves so quickly in one direction that certain price levels are left untested or unbalanced on the order books. Markets frequently retrace to fill these gaps, treating them as dynamic magnets for price action before resuming a primary trend or completing a correction. The convergence of fair value gaps and sell-side liquidity near the current technical structure provides a roadmap for how market observers expect price delivery to unfold in the near future.
The insights, originally shared on the TradingView platform by the contributor known as ForexDetective—who maintains an active presence across various digital channels including X and YouTube—form part of a broader ecosystem of technical commentary utilized by independent traders and market analysts. Such analyses serve as a focal point for discussion within the global trading community, where participants debate the validity of different technical patterns against a backdrop of evolving macroeconomic data, industrial silver demand from the green energy and technology sectors, and shifting expectations regarding global interest rates.
As is standard across major financial platforms, the dissemination of these technical observations is accompanied by formal disclaimers. The information provided in the underlying analysis does not constitute financial, investment, trading, or other types of advice or recommendations supplied or endorsed by the hosting platform or its affiliates. Market participants are consistently reminded that technical patterns, while valuable for identifying potential liquidity pools and structural pivot points, carry inherent risks, and trading decisions should be weighed carefully against individual risk tolerance and comprehensive market research.
With silver prices continuing to react to a complex mix of safe-haven demand, industrial consumption forecasts, and currency fluctuations, the technical markers highlighted in the latest XAG/USD evaluation offer a structured lens through which market participants can interpret ongoing price action. Whether the observed bearish channel and completed wave sequences will culminate in a deeper retracement or lay the groundwork for a future trend reversal remains a central question for traders navigating the precious metals sector in the current market environment.

Comments (0)