


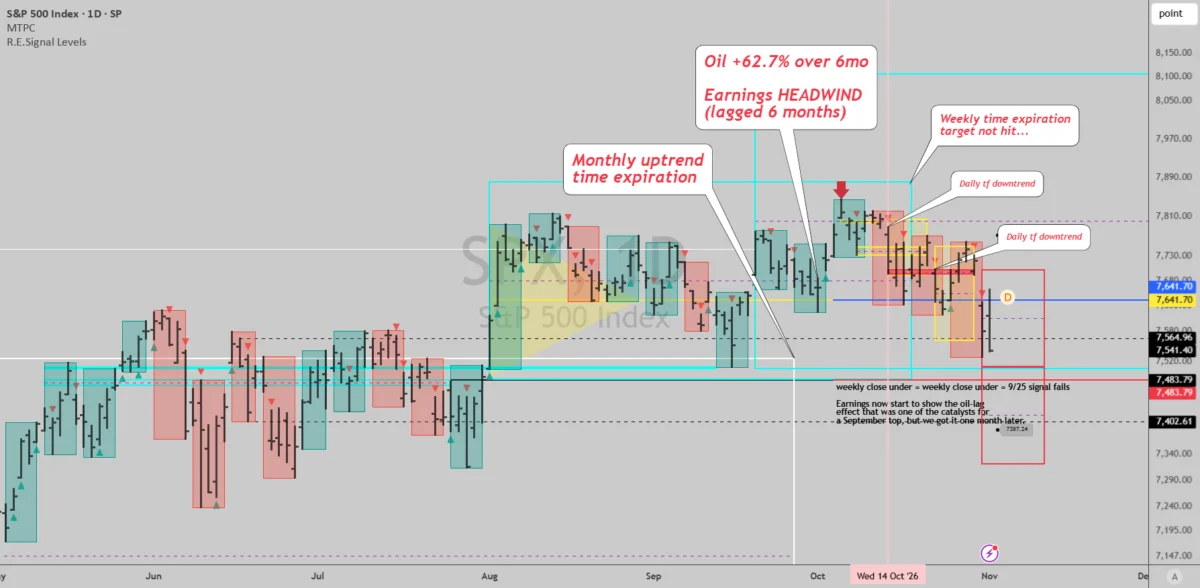
As financial markets navigate the final stretch of the year, veteran market observer Ivan Labrie has issued a comprehensive follow-up market update, designated as a continuation of his previous analytical breakdowns. On the surface, current market conditions might easily be mistaken for a standard, routine downward correction within the context of a broader, well-established bull market. This surface-level resilience appears supported by robust macroeconomic data, notably highlighted by third-quarter Gross Domestic Product coming in at a strong 3.4 percent, alongside a core Personal Consumption Expenditures price index printing at 3.1 percent. These economic indicators continue to keep the possibility of a Federal Reserve interest rate hike in December firmly on the table, presenting a dual narrative of economic strength and lingering monetary policy tightening pressures that traders must carefully evaluate.
Looking closer at the technical landscape, however, the intermediate and longer-term timeframes reveal a more complex and potentially precarious environment. On the weekly price chart, the benchmark S&P 500 index has now recorded two consecutive weekly closes below the critical weekly mode level. Specifically, the market printed levels of 7,623.68 during the week of October 23, followed by a subsequent close at 7,580.07 during the week of October 30. Despite these consecutive closes below the weekly mode threshold of 7,641.70, Labrie notes that the weekly timeframe has yet to flash a definitive, clear directional signal, effectively characterizing the current weekly price action as choppy and indecisive market noise.
Evaluating the historical trajectory of previous signals on the weekly chart, Labrie points out that the bullish weekly signal generated back in August ultimately expired as a failure, failing to sustain its upward momentum. Meanwhile, a subsequent weekly signal issued on September 25 remains technically alive, provided the market maintains price action above the key threshold of 7,483.79, with an ambitious upside target set at 8,105.87. However, given the prevailing market dynamics, Labrie evaluates the probability of achieving this target as low, suggesting that market participants should temper expectations regarding a swift continuation of the prior bullish trend on this timeframe.
While the weekly chart presents a mixed picture of chop and low-probability targets, the daily timeframe is where Labrie identifies the most pressing and immediate danger for market participants. The technical structure on the daily chart has deteriorated following a temporary period of mean reversion. After the second daily downtrend expired, the market quickly faced renewed selling pressure, which was subsequently confirmed by the formation of a third daily downtrend signal. Within this current bearish setup, technical downside targets are clearly defined at 7,509 and 7,320, outlining a potentially significant path lower if current support structures fail to hold.
Adding to the broader technical concerns, the monthly timeframe is also beginning to look increasingly dangerous. This shift in sentiment on the higher timeframe comes as the previous monthly uptrend has officially expired, coinciding with broader macroeconomic shifts, including the lagging economic effects of oil price fluctuations beginning to materialize across financial markets. The convergence of an expired monthly uptrend and these emerging macroeconomic headwinds creates an environment where long-term investors must remain exceptionally vigilant.
Defining the precise parameters for risk management, Labrie outlines the strict technical invalidation level for the current daily downtrend at 7,751.53, which represents the stop level associated with the most recent downtrend contained within the primary analytical red box. Nevertheless, Labrie emphasizes that shifting to an overtly bullish stance will require far more than merely breaching this specific invalidation level. For the daily chart to successfully establish a genuine bullish reversal, the market needs to build a solid base over the course of several days. Specifically, Labrie highlights the necessity of observing at least five consecutive bars featuring higher lows, followed by an impulsive upward surge once the underlying asset has experienced sufficient market accumulation.
Until such constructive technical criteria are definitively met, Labrie maintains his overall bearish posture on the asset. At the same time, he remains pragmatic and fully cognizant of external market catalysts that could rapidly invalidate technical projections. Specifically, he warns that lurking risks for existing short positions include major geopolitical or domestic political developments, such as a potential resolution to the ongoing war involving Iran or unexpected outcomes related to the midterm elections. Either of these high-impact catalysts possesses the capacity to trigger a violent, rapid trend reversal, catching short-term market participants off guard.
Concluding his current market assessment, Labrie assured followers that he will continue to monitor incoming price action closely and provide timely updates as the situation evolves.
Disclaimer
The information and publications provided in this market analysis are not meant to be, and do not constitute, financial, investment, trading, or other types of advice or recommendations supplied or endorsed by TradingView. Readers are encouraged to read more detailed terms and conditions in the official policies and terms of use regarding investment decisions and trading.

Comments (0)