


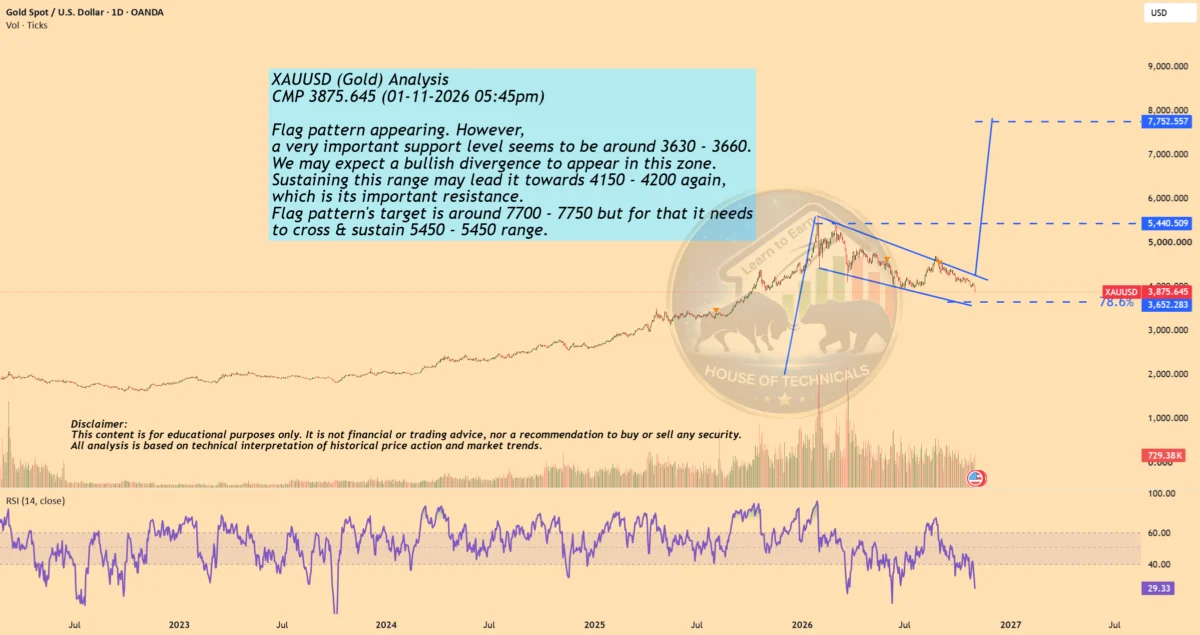
As precious metals navigate a complex macroeconomic landscape, market participants are closely monitoring the latest technical developments for gold. Trading under the ticker symbol XAUUSD and currently trading at a Current Market Price (CMP) of 3,875.645 as of 05:45 PM on November 1, 2026, the yellow metal is presenting a fascinating setup across multiple timeframes. While longer-term chart formations hint at extraordinarily ambitious structural targets, immediate attention from market participants remains squarely fixed on a vital near-term support floor.
At this juncture, technical analysts examining the price action are highlighting the early formation of a classic continuation pattern on the charts. A Flag Pattern appears to be developing, which traditionally signals a brief consolidation phase within a broader, pre-existing trend before a potential resumption of the primary direction. However, rather than looking exclusively at the long-term implications of this pattern right away, market strategists emphasize that the immediate focus should remain directed toward the 3,630–3,660 support zone. This specific price corridor holds immense technical importance, acting as a line in the sand for bulls defending recent market structure.
Adding weight to this crucial support area, technical indicators are beginning to show early signs of momentum shifting beneath the surface. Market observers note that we may also see a bullish divergence developing around this support area, a phenomenon that typically occurs when the price registers lower or flat moves while momentum oscillators begin to print higher lows. Such a technical divergence often serves as an early warning sign of exhaustion among sellers and a precursor to a potential shift in short-term momentum.
Should the price of gold manage to successfully defend and sustain this crucial zone, market expectations point toward a potential corrective rebound. In the event of a successful defense, a recovery move towards the 4,150–4,200 range could very well be on the cards for XAUUSD. This upper region is not merely a random psychological figure; rather, it remains an important resistance zone where prior selling pressure has historically emerged, making it a critical area for traders to monitor if a recovery materializes.
Looking beyond the immediate daily fluctuations and zooming out to examine the broader chart structure, the developing Flag Pattern carries a much larger theoretical projection. Based on standard technical analysis principles measuring the length of the prior flagpole and projecting it from the breakout point, the pattern maps out a potential longer-term target stretching all the way toward the 7,700–7,750 region.
Nevertheless, market analysts are quick to temper these lofty expectations with necessary technical caveats. This grand projection remains entirely conditional and dependent on the market first navigating and overcoming major overhead hurdles. Specifically, the price of gold would need to cross and decisively sustain above the 5,450 resistance zone before any discussion of reaching the upper targets can be validated in a real-world market environment. Until such structural milestones are achieved, the multi-thousand-dollar extension remains purely a longer-term macro possibility rather than an immediate trading reality.
Weighing the various factors at play, the overall market view presents a compelling dual narrative for gold. While the broader bullish possibility remains exceptionally interesting from a macro-technical perspective, the immediate reality dictates that the 3,630–3,660 support zone is the absolute center of gravity in the near term. Market participants understand that patience and discipline will be paramount, as confirmation at each subsequent resistance level will be vitally important before anyone can realistically anticipate or position for the larger, more extended macro move. As the session progresses, all eyes will remain locked on how XAUUSD interacts with these pivotal technical boundaries.
Disclaimer: The information and publications provided in this analysis are for informational purposes only and are not meant to be, and do not constitute, financial, investment, trading, or other types of advice or recommendations supplied or endorsed by TradingView.

Comments (0)