


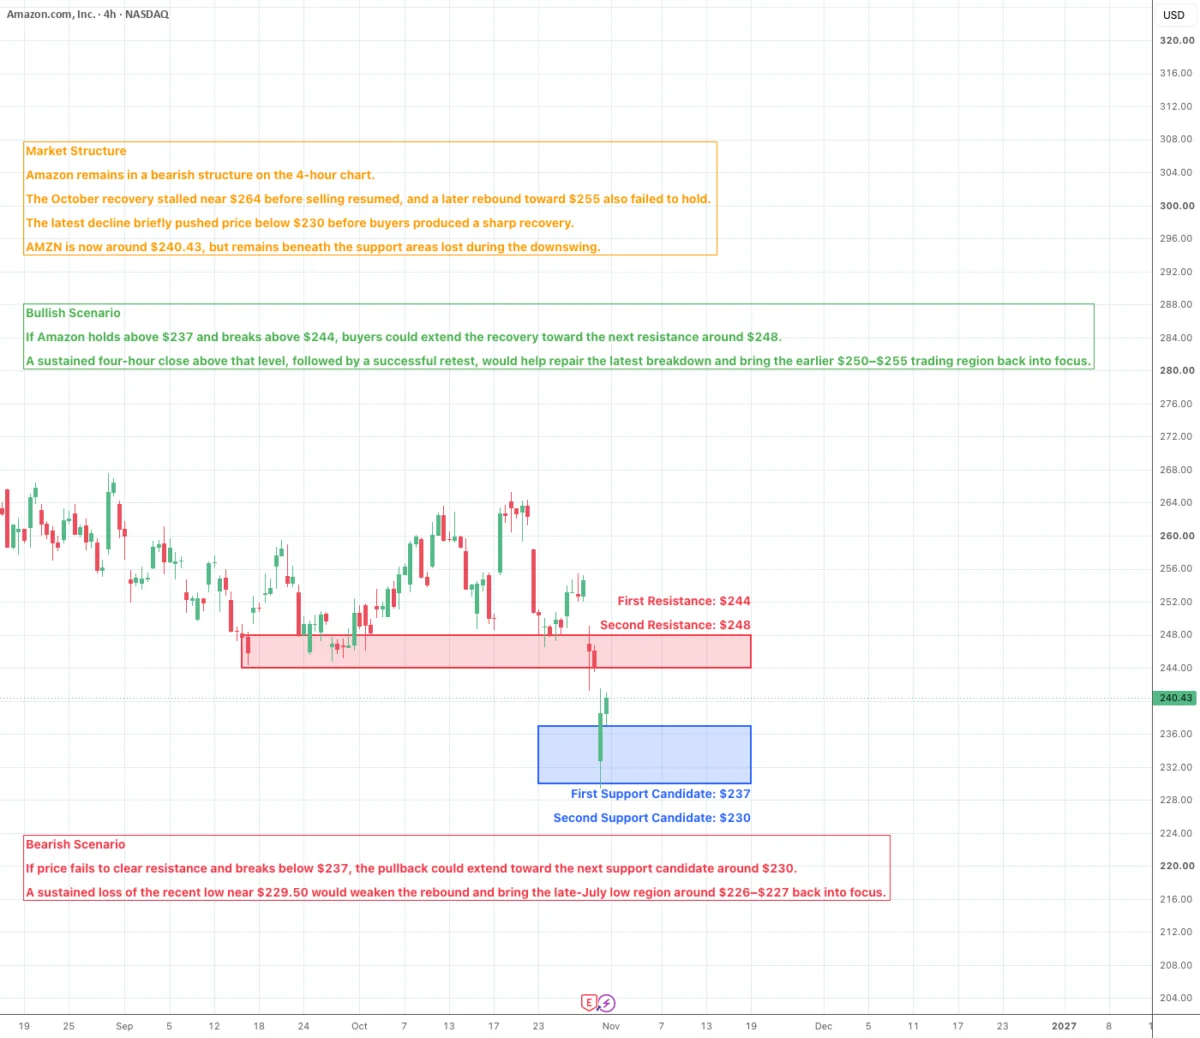
Amazon finds itself at a critical technical juncture as the e-commerce and cloud computing giant attempts to stabilize following a sharp multi-week decline. On the 4-hour chart, the stock remains locked within a broader bearish market structure, yet recent price action has introduced a glimmer of hope for short-term traders. After a series of failed recovery attempts earlier in the autumn, buyers have stepped in aggressively following a dip below the psychological $230 threshold, injecting a new wave of momentum into the asset. While the overarching downtrend is far from invalidated, the intensity of the latest bounce has market participants closely watching key resistance levels to determine whether this is the beginning of a durable bottom or merely a temporary reprieve in a larger bearish cycle.
Market Structure and Recent Price Action
To understand Amazon’s current position, one must examine the trajectory of its recent sessions. The stock’s troubles deepened following a stalled recovery attempt in October near the $264 mark. From that apex, selling pressure quickly resumed, dragging the equity lower. A subsequent rebound toward $255 also failed to maintain its footing, confirming that sellers remained firmly in control of medium-term momentum.
The downward trajectory culminated in a sharp flush that briefly sliced through the $230 support level. However, this dip below $230 triggered an immediate and aggressive response from the buy-side. Rather than cascading into a deeper capitulation, the selloff was met with a swift recovery that retraced a substantial portion of the final leg down. At last check, AMZN is changing hands around $240.43. Despite this encouraging bounce, the stock continues to trade well beneath the crucial support areas that were surrendered during the earlier downswing, keeping the broader market structure tilted to the downside.
Market Sentiment: Cautious Optimism Coexisting with Persistent Bearish Realities
Current market sentiment around Amazon can best be described as deeply cautious, though punctuated by improving short-term momentum. The speed and conviction of the rebound from the recent swing low demonstrate that buyers are more than willing to defend lower valuations and step in with capital when panic selling takes hold. This aggressive accumulation at depressed levels suggests that the market does not view the recent breakdown as a permanent structural shift in Amazon’s underlying business value, at least in the near term.
Nevertheless, sentiment remains guarded because the broader lower-high structure—the defining characteristic of a bearish trend—remains fully intact. A single strong intraday or multi-hour bounce is rarely enough to reverse weeks of sustained selling. For sentiment to shift from cautious observation to genuine bullish conviction, the stock needs to see meaningful follow-through buying that can successfully pierce and hold above established overhead resistance zones. Until that occurs, market participants are treating the advance as a corrective bounce within a larger corrective phase rather than a definitive trend reversal.
Bullish Scenarios: The Path to Recovery
For the bulls to seize control and repair the structural damage inflicted over the past two months, Amazon must navigate a specific sequence of technical milestones. The immediate task for buyers is to defend the newly established floor around the $237 region. As long as the stock holds above this critical threshold, the foundation remains intact for another push toward the first major hurdle at $244.
A successful break above $244—which sits near the lower boundary of the trading range that preceded the latest selloff—would signal that buyers are actively reclaiming territory lost during the breakdown. However, the true test of bullish intent lies higher up. If AMZN can extend its advance toward the $248 resistance zone, a region tied to a previous October trading cluster, and print a sustained four-hour close above it, the recovery narrative gains significant credibility. A successful retest of this level as newfound support would effectively neutralize the most recent breakdown, turning the market’s attention back toward the highly coveted $250 to $255 trading region that acted as a stumbling block earlier in the season.
Bearish Scenarios: Risks of a Downside Continuation
Conversely, if the current recovery loses steam and buyers fail to clear immediate overhead hurdles, the bearish scenario threatens to resume dominance. Should the price falter and break below the crucial $237 support candidate, the door opens for an expedited pullback toward the next technical floor near the $230 mark.
A decisive and sustained loss of the recent low, which stands right around $229.50, would severely undermine the narrative of a developing bottom. Such a breakdown would not only invalidate the recent bullish defense but also expose the stock to renewed liquidation pressure, bringing the late-July low region—roughly spanning $226 to $227—back into sharp focus. In that environment, the tentative stabilization efforts observed over the past few sessions would be reclassified as a routine bear-market rally, paving the way for deeper losses.
Comprehensive Analysis of Key Technical Levels
Navigating Amazon’s current trading range requires a careful eye on specific price boundaries that are currently dictating market behavior. On the upside, the First Resistance is situated at $244. This level represents the lower portion of the consolidation area that immediately preceded the latest aggressive selloff. Reclaiming this barrier would provide tangible proof that buyers are successfully rolling back the effects of the recent breakdown.
The Second Resistance rests higher at $248, embedded within a dense October trading cluster that the price has struggled to regain since falling through it. A sustained hold above this second tier would signify a far more comprehensive technical repair of the recent downturn, shifting the medium-term balance of power.
On the downside, the First Support Candidate is pegged at $237, aligning closely with the latest candle low of $237.11 and marking the upper boundary of the recent sharp rebound. Because this level has only just emerged as a defensive line, its reliability as a genuine support structure still requires formal confirmation during a subsequent pullback and retest.
The Second Support Candidate is located at the psychologically significant round number of $230, which overlaps tightly with the recent swing low of approximately $229.50. While this zone also intersects with historical trading volume from late July, the fact that it was recently breached suggests that a durable floor has not yet been definitively established.
Event Risk and Broader Market Catalysts
Beyond pure technical analysis, Amazon remains vulnerable to a slate of fundamental event risks and macroeconomic sentiment shifts. The stock’s medium-term trajectory will inevitably be guided by broader market expectations surrounding upcoming corporate earnings reports, management guidance, cloud computing growth metrics within Amazon Web Services (AWS), consumer retail demand resilience, operating margin expansions, and capital expenditure plans. Furthermore, sentiment across the broader technology sector will play an influential role in determining whether large-cap growth stocks can attract the institutional inflows necessary to sustain a broad-based recovery.
Even so, veteran market observers emphasize that near-term price action remains the ultimate diagnostic tool. If fundamental developments or corporate headlines are unable to propel AMZN through established overhead resistance, the recovery momentum is likely to stall out. Conversely, if the stock experiences a routine pullback that successfully holds above recent lows despite any negative external noise, it will provide powerful behavioral evidence that institutional buyers are actively absorbing supply and building a legitimate base.
Market participants continue to monitor whether Amazon can successfully construct a higher low followed by a decisive advance, a sequence that would offer far more compelling stabilization evidence than a standalone bounce. As the session unfolds, traders are weighing whether buyers possess the stamina to reclaim the $244 to $248 corridor or if persistent sellers will ultimately force another anxious test of the $230 support region.

Comments (0)