


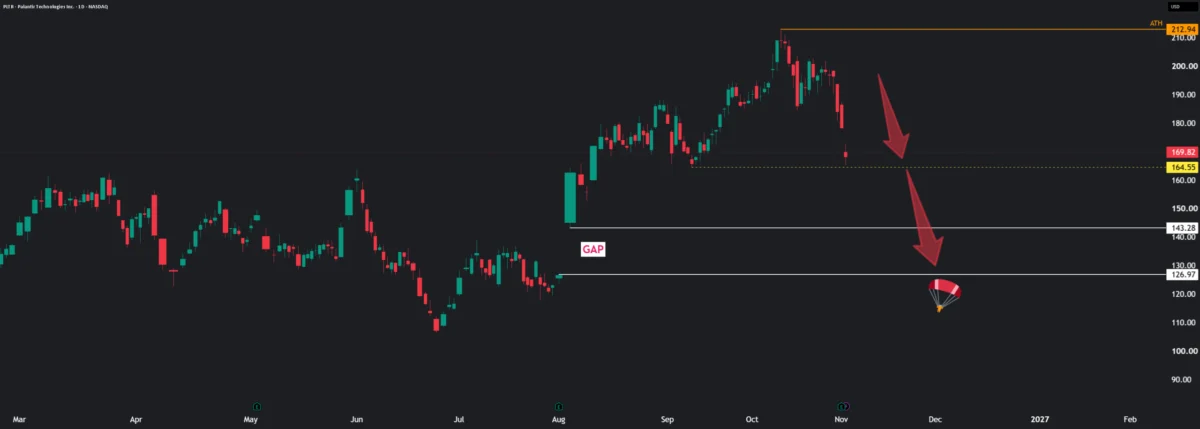
Palantir Technologies experienced a turbulent trading session, finishing down 4.34% on the day, yet the underlying price action on the daily candle paints a far more nuanced picture of market sentiment. After plunging to an intraday low of $165.25, persistent buying pressure emerged, pushing the stock back up to close at $170.60. This recovery managed to lift the price comfortably above the session’s opening mark of $168.18, marking a notable intraday comeback, though market observers note that the bulls have not yet secured a definitive victory.
For the time being, market analysts view this price movement as a tentative rebound attempt rather than a confirmed trend reversal. The trajectory of upcoming daily candles will be critical in determining whether buyers can successfully defend this intraday recovery and build upon it, or if renewed selling pressure will ultimately take control of the tape.
With Palantir, high volatility remains a constant factor for traders and investors alike. The stock possesses a well-known tendency to generate dramatic chart formations and sharp price swings in remarkably short spans of time, keeping market participants on high alert throughout the trading day.
A closer examination of today’s key chart levels highlights the extent of the session’s volatility. The stock registered a daily low of $165.25 and opened the session at $168.18, before staging its recovery to settle at a current reading of $170.60, culminating in a net daily change of minus 4.34%.
Market participants are closely monitoring the charts for clear signs of follow-through before drawing any broader bullish conclusions. While a single green candle emerging within the context of a rough and volatile session offers an encouraging sign of underlying demand, it does not constitute a full trend change on its own.
As always, technical chart observations serve as tools for market analysis rather than definitive investment advice, and active market participants are reminded to manage risk strictly according to their own established trading plans. The observations were shared by Laurent, a private investor and community leader at DL INVEST.
Disclaimer: The information and publications provided are not meant to be, and do not constitute, financial, investment, trading, or other types of advice or recommendations supplied or endorsed by TradingView. Additional details regarding terms of use and policies can be found on their official platform.

Comments (0)