


Strategy Inc., the business intelligence software firm that famously transformed into the world’s preeminent corporate Bitcoin treasury vehicle, finds itself navigating a precarious technical and fundamental landscape. As equity markets digest the ripple effects of a tumultuous third quarter, the company—formerly known as MicroStrategy—is grappling with downward price momentum, shifting investor sentiment, and the relentless gravitational pull of the cryptocurrency market.
At the center of this financial narrative is an unprecedented accumulation of digital assets. According to corporate data finalized late last month, Strategy held an astounding 848,517 BTC on its balance sheet. These digital holdings were accumulated at a total cost of approximately $64.02 billion, translating to an average acquisition cost of $75,446 per coin. This massive exposure has fundamentally altered the corporate identity of the firm, tying its operational destiny, market valuation, and equity performance almost entirely to the volatile price action of the world’s leading cryptocurrency.
Financing Structures, Share Dilution, and Market Valuations
The mechanism by which Strategy funds its aggressive Bitcoin acquisition strategy has increasingly come under the microscope of institutional investors and market analysts. The company relies on a complex capital-raising architecture, routinely issuing common stock, preferred shares, and convertible debt to fund its ongoing cryptocurrency purchases. While this aggressive leverage allows the firm to continually expand its digital footprint, it simultaneously introduces profound structural risks, including sensitivity to Bitcoin price retracements, ongoing financing obligations, and the persistent threat of equity dilution for existing shareholders.
Because of this unique operational framework, Strategy’s equity trades with a remarkably high beta—hovering near 3.6—meaning the stock frequently experiences dramatic price swings that far outpace the broader equity markets. Furthermore, the company’s market valuation is heavily dictated by the premium that investors are willing to assign to its underlying digital asset portfolio. By the close of October, Strategy’s market-to-net-asset-value multiple stood at approximately 1.1x. This compressed multiple indicates that the market is assigning relatively little premium above the actual net value of the Bitcoin held on its balance sheet, reflecting a more cautious stance among institutional allocators.
Stock Price Action and Long-Term Trend Analysis
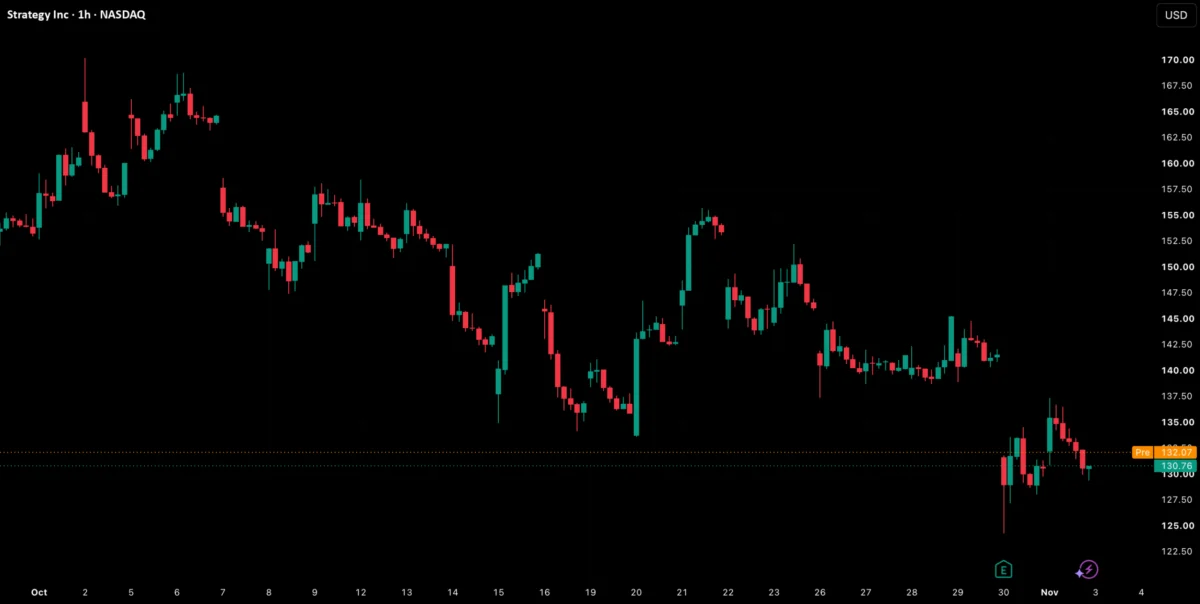
The recent trajectory of Strategy’s stock, trading under the ticker MSTR, reflects a broader downtrend that has gripped the asset since the final months of 2025. After peaking near $270 in early November 2025, the shares embarked on a punishing descent, culminating in a 52-week low of $81.81 on June 26, 2026. That severe correction represented a staggering 70% drawdown from its prior highs, mirroring the broader cyclical pressures hitting the digital asset ecosystem during that period.
However, the summer months brought a notable reprieve. MSTR engineered a powerful summer recovery, surging 76% during the third quarter as Bitcoin itself mounted a robust advance from roughly $58,700 to $83,600. Yet, this bullish momentum hit a wall as the calendar turned to October. Following an early-month push toward $165, the stock began printing a series of lower highs, signaling waning upside conviction. A mid-October slide toward $137 prompted tentative relief bounces into the upper $140s and near $155, but none of these recoveries possessed the strength required to re-establish the previous upward trajectory.
Selling pressure intensified dramatically following the release of Strategy’s third-quarter financial results on October 29. The subsequent trading session on October 30 saw the stock open near $131.70 before sliding to an intraday low of $124.06. Although late-session buying interest helped the stock pare some of those losses to close at $130.51, the daily decline measured a sharp 7.84%. Trading volume during the session ballooned to 34.01 million shares, registering at approximately 1.5 times its historical average and underscoring the intensity of the institutional repositioning.
The Technical Setup and Key Price Levels
From a technical perspective, MSTR is currently testing a crucial zone of support clustered between $125.92 and $129.53. This tight band represents an intersection of Classic, Woodie, and Fibonacci pivot levels, making it a critical line of defense for the bulls. Immediately below this zone, the October 30 intraday low of $124.06 provides a secondary reference point. Market technicians note that a sustained, high-volume break beneath these thresholds would likely expose the 100-day simple moving average at $121.69, followed closely by the Fibonacci S2 pivot at $117.77. Further downside exposure could eventually target the $98.74 to $100.25 region, leaving the 52-week low of $81.81 as the ultimate historical backstop.
Conversely, the path of resistance for any prospective recovery remains heavily fortified. Initial overhead supply is clustered between $134.51 and $134.56, combining the October 30 session high with the 200-day simple moving average. Beyond that immediate hurdle lies the $136.64 to $138.23 range, which incorporates the 100-day exponential moving average and the Hull Moving Average. Additional resistance barriers sit within the $140.32 to $142.25 and $144.55 to $148.55 zones, culminating near the 200-day exponential moving average at $151.82. Across the broader technical landscape, moving-average groups remain firmly entrenched in a "Strong Sell" posture, supported by 13 sell signals, one neutral reading, and a single buy signal.
Momentum oscillators, meanwhile, point toward a state of potential stabilization without offering definitive confirmation of a broader trend reversal. The 14-period Relative Strength Index stands at 40.11, reflecting underlying weakness while remaining comfortably above traditional oversold parameters. More acute readings appear in the Commodity Channel Index at -170.41 and Williams %R at -79.93, both of which linger near oversold territory. The Moving Average Convergence Divergence indicator remains in a sell configuration at -182, while the Average Directional Index at 18.25 signals limited overall trend strength. While oscillator summaries lean neutral, combined technical models continue to flash warning signs for short-term traders.
Divergent Perspectives: Wall Street Optimism Versus Technical Reality
Despite the palpable technical headwinds, Wall Street sentiment stands in stark contrast to the prevailing price action. Among a tracked group of 22 institutional analysts covering the stock, 18 currently maintain a "Strong Buy" rating, two rate the shares a "Buy," and two advocate a "Hold," with zero sell ratings reported across the board.
The consensus 12-month price target compiled from 18 of these analysts sits at $239.33, representing an implied upside of roughly 83% relative to the stock’s October 30 closing price. Individual forecasts vary widely—ranging from a conservative target of $165 to an aggressive high of $435—reflecting differing underlying assumptions regarding the future trajectory of Bitcoin and the long-term viability of Strategy’s financing model. Recent adjustments from major financial institutions include B. Riley lifting its price target to $195, Barclays raising its target to $175, and BTIG reiterating its Buy rating alongside a $250 target. However, market observers point out that these forward-looking valuations are predicated on long-term assumptions about digital asset adoption rather than immediate technical recovery.
Fundamental Drivers and the Earnings Impact
Strategy’s financial results for the third quarter laid bare the extent to which corporate performance is inextricably linked to the fair-value accounting of its digital asset holdings. The company reported operating income of approximately $20.9 billion and net income of $19 billion, yielding a diluted earnings per share of $44.75. The lion’s share of this profitability was derived directly from accounting gains realized as Bitcoin appreciated in value over the course of the quarter.
Beneath the headline-grabbing net income figures, however, traditional operational metrics revealed pockets of strain. Core revenue contracted by 2.5% year-over-year to $125.4 million, falling short of consensus expectations. Furthermore, the metric tracking Bitcoin per diluted share declined by 3.7% year-to-date, feeding investor anxieties that the constant issuance of new equity to fund acquisitions may be outpacing the actual accumulation of underlying coins on a per-share basis.
The company also disclosed approximately $6.7 billion in outstanding convertible debt while confirming that none of its massive Bitcoin cache is currently encumbered by liens or loans. Nevertheless, ongoing preferred dividend obligations and the continuous need for liquidity to service debt remain crucial variables for investors to monitor, particularly if digital asset prices experience prolonged periods of consolidation or decline.
Evaluating the Bear and Bull Cases
The prevailing market debate surrounding Strategy hinges on two competing interpretations of its current financial standing. The bullish thesis relies on the premise of structural stabilization near the current technical support zone and a subsequent resurgence in the broader cryptocurrency market. Proponents of this view emphasize the stock’s resilience following its intraday bounce from $124.06, combined with oversold momentum indicators and unwavering support from institutional equity analysts. Should MSTR successfully defend the $126 to $129.50 support cluster and punch through immediate resistance at $134.56, bulls argue that a pathway opens toward the $140–$142 zone, bringing the early-October highs near $165 back into view.
Conversely, the bearish outlook is anchored by persistent technical degradation and unyielding correlation to Bitcoin’s price fluctuations. Bearish analysts point out that MSTR continues to trade below virtually every major moving average, with the vast majority of technical signals flashing sell recommendations. The formation of lower highs throughout October demonstrates that sellers maintain structural control of the tape. A confirmed breakdown below the $124 threshold, according to this perspective, would likely accelerate selling toward the 100-day simple moving average at $121.69, followed by deeper supports at $117.77 and potentially the psychological $100 milestone if cryptocurrency markets face further downside pressure.
Ultimately, Strategy remains tethered to a high-risk, high-reward proposition. With a beta of 3.6, robust daily volatility is all but guaranteed as the market weighs the value of its unprecedented corporate treasury against the realities of equity dilution, technical resistance, and the unpredictable movements of the global digital asset market.

Comments (0)