


In the realm of financial market technical analysis, identifying chart levels and structural patterns is only half the battle. As many market participants frequently discover, recognizing a support level, a resistance zone, or a confirmed swing low does not automatically answer the critical questions of where to place a protective stop or how much capital to risk on a given market idea. Addressing this operational gap requires a systematic framework that integrates volatility metrics and standard drawing tools, moving beyond arbitrary round numbers or fixed pip limits.
A detailed examination of recent market activity on the XAUUSD four-hour chart hosted on OANDA highlights a practical, written-down approach to solving both stop placement and position sizing. While this methodology serves as an analytical case study rather than a direct trade recommendation, it illustrates the mechanics of risk management through the application of the Average True Range (ATR) indicator and predefined invalidation rules.
Establishing Invalidation Before Entry
The foundational principle of this methodological approach dictates that every market idea requires a clearly defined price point where the premise is proven wrong, established before any other consideration takes place. In the context of the analyzed gold chart, the baseline hypothesis posits that a confirmed swing low will hold against downward price pressure.
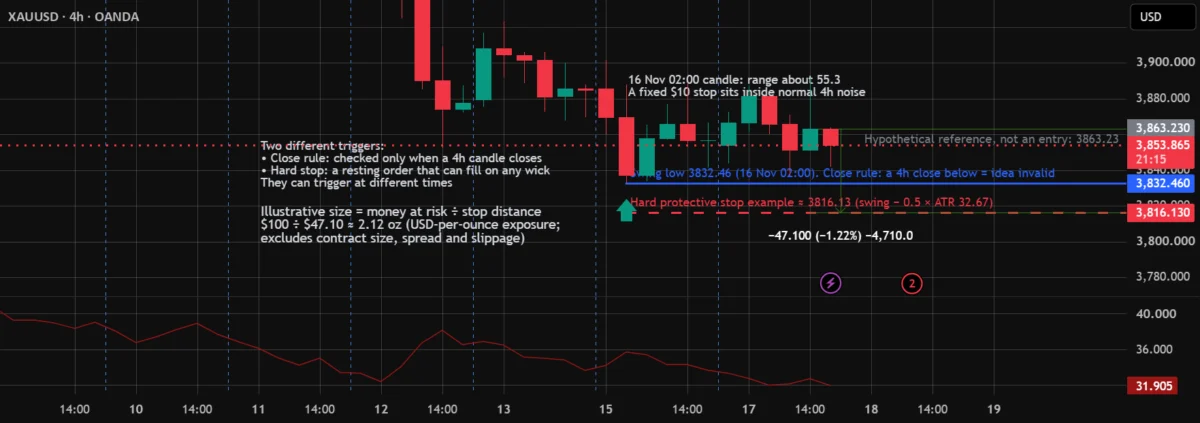
Identifying this swing low requires strict criteria, specifically a confirmed point where a swing low forms only after five closed four-hour candles have successfully printed on each side of the pivot. Following this rule on the examined chart points to a swing low registered on November 16 at 02:00 UTC, corresponding to a price of 3832.46.
To determine when this specific market thesis fails, analysts employ a close-based invalidation rule. Rather than reacting to intraday price fluctuations or sudden market spikes, this rule dictates that the market idea is only invalidated if a four-hour candle officially closes below the 3832.46 threshold. Crucially, this condition is checked strictly at the moment a four-hour candle completes its cycle, ensuring that decisions are made based on confirmed closing prices rather than temporary market noise.
Integrating Volatility into Hard Protective Stops
While a close-based rule governs the conceptual validity of a market thesis, managing actual capital exposure requires a separate hard protective stop. Unlike a candle-close rule, a hard protective stop functions as a resting order capable of executing at any moment, including during an aggressive intraday price wick in the middle of an active candle session. Relying on arbitrary round numbers for these stops often exposes capital to unnecessary risk, as standard market volatility can easily breach tight, arbitrary boundaries.
To construct a dynamic and context-aware protective stop, the methodology incorporates the 14-period Average True Range (ATR). Calculations taken at the close of the November 17 14:00 candle revealed an ATR(14) value of 32.67, indicating that the average four-hour candle during that phase covered a distance of approximately $33.
Applying a volatility buffer—in this illustrative case, half of the ATR value, or 16.335—establishes a hard protective stop level significantly removed from standard market noise. Subtracting this buffer from the swing low of 3832.46 yields a hard stop price of approximately 3816.13.
The necessity of this volatility-based approach becomes evident when compared against arbitrary metrics. For instance, attempting to utilize a fixed $10 stop would fail to account for prevailing market conditions; the single candle from November 16 at 02:00 registered a total price range of approximately 55.3, while the preceding twenty closed four-hour candles averaged a range of about 33.75. A fixed $10 stop would sit well inside normal four-hour price movement, guaranteeing frequent and premature order executions.
Differentiating Close Rules from Hard Stops
A critical takeaway from this analytical framework is that close-based invalidation rules and hard protective stops operate independently and can trigger under entirely different market circumstances.
Under the first scenario, a four-hour candle can officially close below the crucial invalidation level of 3832.46 without the underlying price ever descending far enough to reach the hard stop at 3816.13. In this instance, the close rule dictates that the core market thesis has failed, prompting a planned exit, even though the hard protective stop order has remained untouched by the market.
Conversely, market mechanics can produce the opposite outcome via a sharp, fast price wick. A sudden liquidity sweep or intraday volatility spike can easily reach the hard stop level of 3816.13 to fill the resting order, while subsequent buying pressure allows the candle to recover and eventually close back above the 3832.46 invalidation threshold by the end of the four-hour session. Here, the hard
stop has already been executed, whereas a strict close-based rule would have technically maintained the validity of the original idea.
Because these two mechanisms can yield divergent outcomes, traders utilizing such systems must decide in advance whether they rely on one exclusively, how they intend to combine them, and record those parameters before entering a position.
Sizing Positions Based on Stop Distance
Once the hard protective stop distance is firmly established through volatility metrics, it dictates the appropriate position size, reversing the common mistake of letting desired position sizes dictate stop placement. The foundational formula calculates position size by dividing the total amount of money at risk by the precise stop distance.
To demonstrate this arithmetic through a hypothetical reference price—specifically the November 17 14:00 candle close at 3863.23—the distance to the previously calculated hard stop at 3816.13 equals 47.10 points. Assuming a hypothetical risk profile of risking $100, which represents exactly one percent of a $10,000 trading account, the resulting calculation divides $100 by the $47.10 stop distance, yielding approximately 2.12 ounces of exposure.
This mathematical illustration operates under the simplified assumption of direct USD-per-ounce exposure, where a one-dollar price movement equals one dollar per ounce. In practical application, market participants must account for specific broker contract-size variations, such as standard per-ounce units, 100-ounce lots, or contract-for-difference (CFD) specifications, alongside trading spreads, commissions, and potential slippage.
The Dynamic Impact of Changing Volatility
A static approach to risk management inevitably fails over extended periods because market volatility is inherently fluid. Historical data from the analyzed gold chart underscores this reality, showing that the ATR(14) reading stood at 24.24 on October 21 before expanding significantly to 38.11 by November 12.
A stop-loss distance tailored to the calmer volatility environment of October would prove entirely inadequate during November, sitting well within normal market noise and leading to frequent whipsaws. Consequently, as market volatility expands, maintaining a consistent monetary risk profile requires a wider stop distance, which mathematically necessitates a smaller overall position size to keep financial exposure capped at the desired percentage.
Recognizing Methodological Limitations
While structured frameworks bring analytical discipline to market observation, every technical choice introduces inherent limitations. Selecting specific parameters, such as a 14-period ATR, a half-ATR buffer, and a four-hour candle close, represents a deliberate choice; altering any of these variables will yield entirely different stop placements and position sizes.
Furthermore, relying on a close-based rule requires participants to wait until the candle officially concludes before executing a decision. By the time the close is registered, fast-moving markets may have driven prices significantly beyond the invalidation level, resulting in unexpected execution metrics. Similarly, hard stop orders executed on rapid intraday price wicks remain vulnerable to gaps or high-slippage environments, meaning neither method can guarantee that realized losses will precisely match pre-planned risk parameters.
The specific numbers and percentages utilized in this analysis serve strictly an illustrative purpose to clarify the underlying calculations. Determining the appropriate percentage of capital to risk per market idea remains an individual decision, with the one-percent benchmark chosen solely for mathematical simplicity. Reviewing historical price action through tools like bar replay can provide valuable insight into how different stop configurations interact with ordinary market fluctuations over time.
The preceding overview is provided exclusively for educational purposes and does not constitute financial advice, an investment recommendation, or a formal trade solicitation.

Comments (0)