



Bitcoin (BTC) continues to encounter formidable market hurdles, with price action heavily compressed in the $84,000 to $85,000 range. According to recent insights from prominent crypto analytics platform Glassnode, this stubborn price ceiling is closely tied to the cost basis of a massive concentration of coins, largely linked to a single large holder redistributing funds across multiple addresses. As traders and analysts evaluate Bitcoin’s next macroeconomic and technical moves, understanding the underlying onchain distribution provides crucial context for why this particular pricing band has acted as a persistent barrier for nearly a year.
Glassnode Ties $85K Resistance to Large-Holder Cost Basis
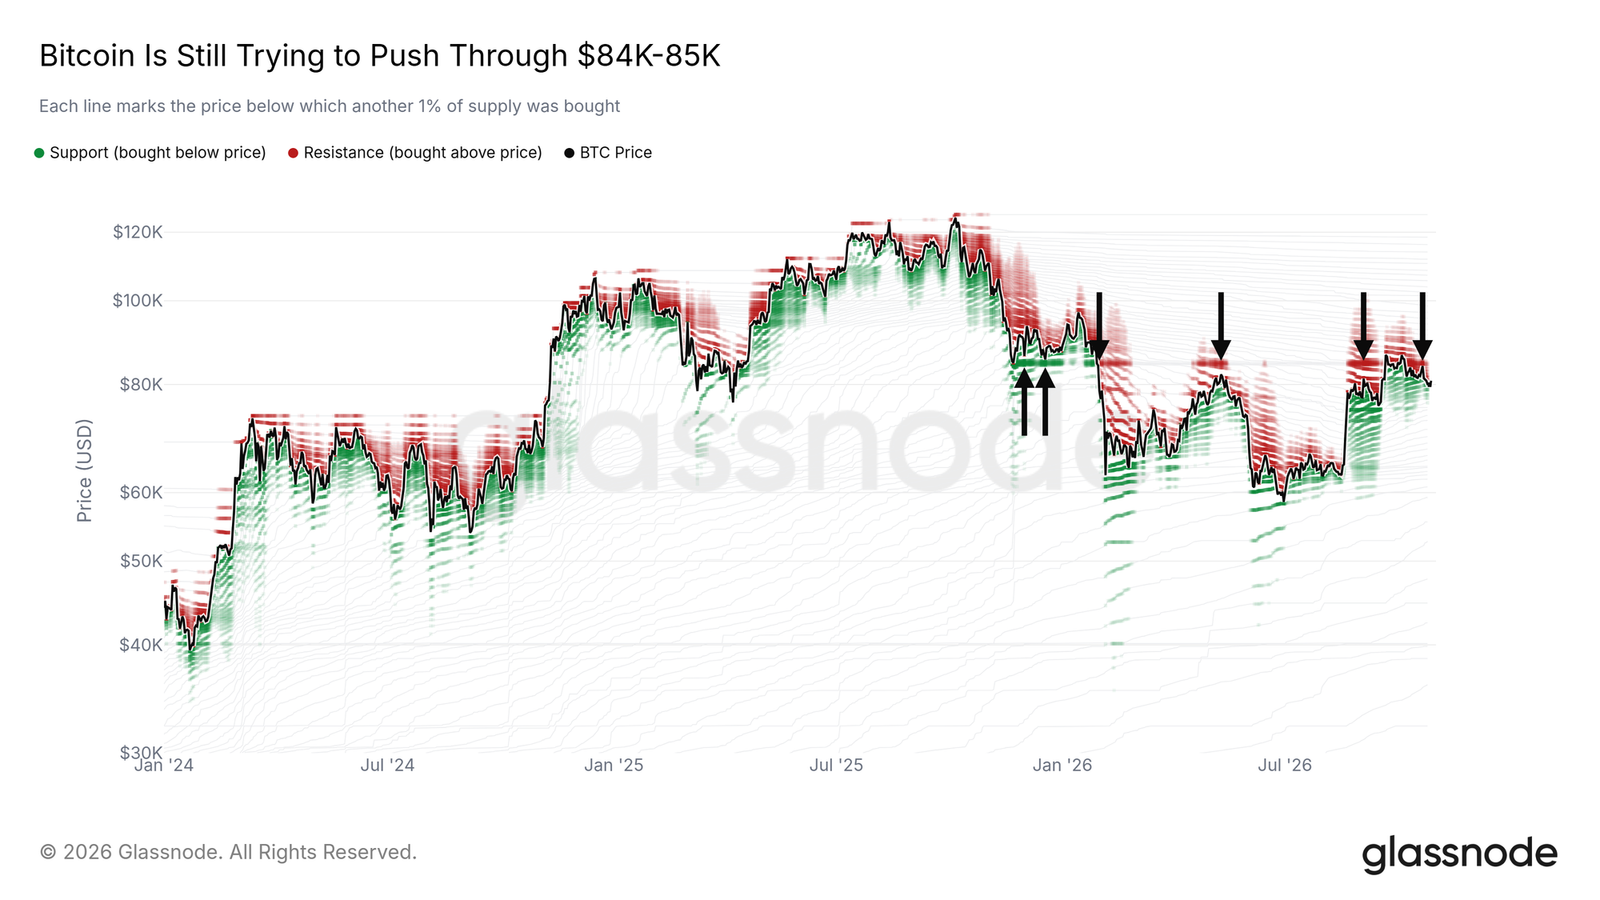
In the latest edition of its regular analytics newsletter, The Week Onchain, crypto research platform Glassnode highlighted the $84,000 to $85,000 bracket as a defining threshold for Bitcoin price action. The significance of this zone stems from a notable wave of onchain activity that occurred on November 22, 2025. During that period, a massive volume of the total Bitcoin supply shifted across the network while BTC traded precisely within the $84,000 and $85,000 range.
The coins that last moved hands at that specific price point account for an impressive 4.3% of the entire circulating Bitcoin supply, translating to approximately 864,520 BTC. Deeper inspection of the transactional data reveals that the overwhelming majority of this supply belongs to a single large-scale entity—commonly referred to in crypto markets as a whale—moving funds internally between multiple wallets. While self-transfers of this nature do not inherently alter market dynamics or represent direct selling pressure, the historical reaction of the broader market to this price level tells a compelling story.
Over the past eleven months, Bitcoin has repeatedly respected the $84,000–$85,000 corridor, treating it alternately as a floor of support and a ceiling of resistance. The historical interplay with this price band illustrates its critical technical importance. The level successfully held as support during December, when Bitcoin’s price cleanly bounced off the zone on December 1 and again on December 18.

However, market structures eventually broke under pressure. The support definitively gave way on January 31, when a recovery attempt back up to the $84,000 threshold failed to sustain momentum. That breakdown triggered a sharp correction, with Bitcoin falling roughly 20% over the subsequent days. Similar exhaustion patterns materialized later in the year. In May, September, and October, upward price momentum repeatedly faded near this exact band, capping local rallies with a high of $87,400. Furthermore, Bitcoin has recorded a mere five daily closes above this crucial band, and never more than three consecutive sessions in a row.
According to Glassnode’s assessment, establishing a decisive string of daily closes comfortably above $85,000 is the primary requirement to flip this historical resistance back into a reliable baseline of support.
Long-Term Holders Pose Sell-Side Risk Above $85,000
While a single large holder’s internal wallet shuffling accounts for a significant chunk of the supply at this level, the $85,000 mark carries broader psychological and economic significance for a much wider segment of the Bitcoin investor base.
Market dynamics are heavily influenced by the behavior of long-term holders (LTHs)—defined analytically as entities that retain a specific balance of Bitcoin without moving it onchain for a minimum threshold of 155 days. Glassnode’s data indicates that this cohort currently commands around 4 million coins that last changed hands onchain at prices ranging between $85,000 and $118,000, with the vast majority of those acquisitions occurring throughout the course of 2025.
Because a significant portion of these coins was accumulated at higher valuations, a large segment of long-term investors is currently sitting on unrealized losses. Glassnode points out that more than half of all coins held by this specific group were purchased at prices exceeding the current market value. Consequently, if Bitcoin stages a sustained recovery rally toward the $85,000 threshold, many of these participants may view the movement as an opportunity to exit near breakeven, creating substantial sell-side pressure that could stall or reverse upward momentum.
This sentiment is further quantified by the Long-Term Holder Spent Output Profit Ratio (SOPR). This onchain metric evaluates whether coins moving onchain are being transacted at a profit or a loss relative to their previous movement. Currently, the LTH SOPR hovers around 0.99. Values resting just below the critical threshold of 1 indicate that the aggregate long-term holder supply is still being transacted at a slight net loss, underscoring why an approach toward their average acquisition cost could trigger defensive selling behavior from investors eager to recover their capital.





Comments (0)