


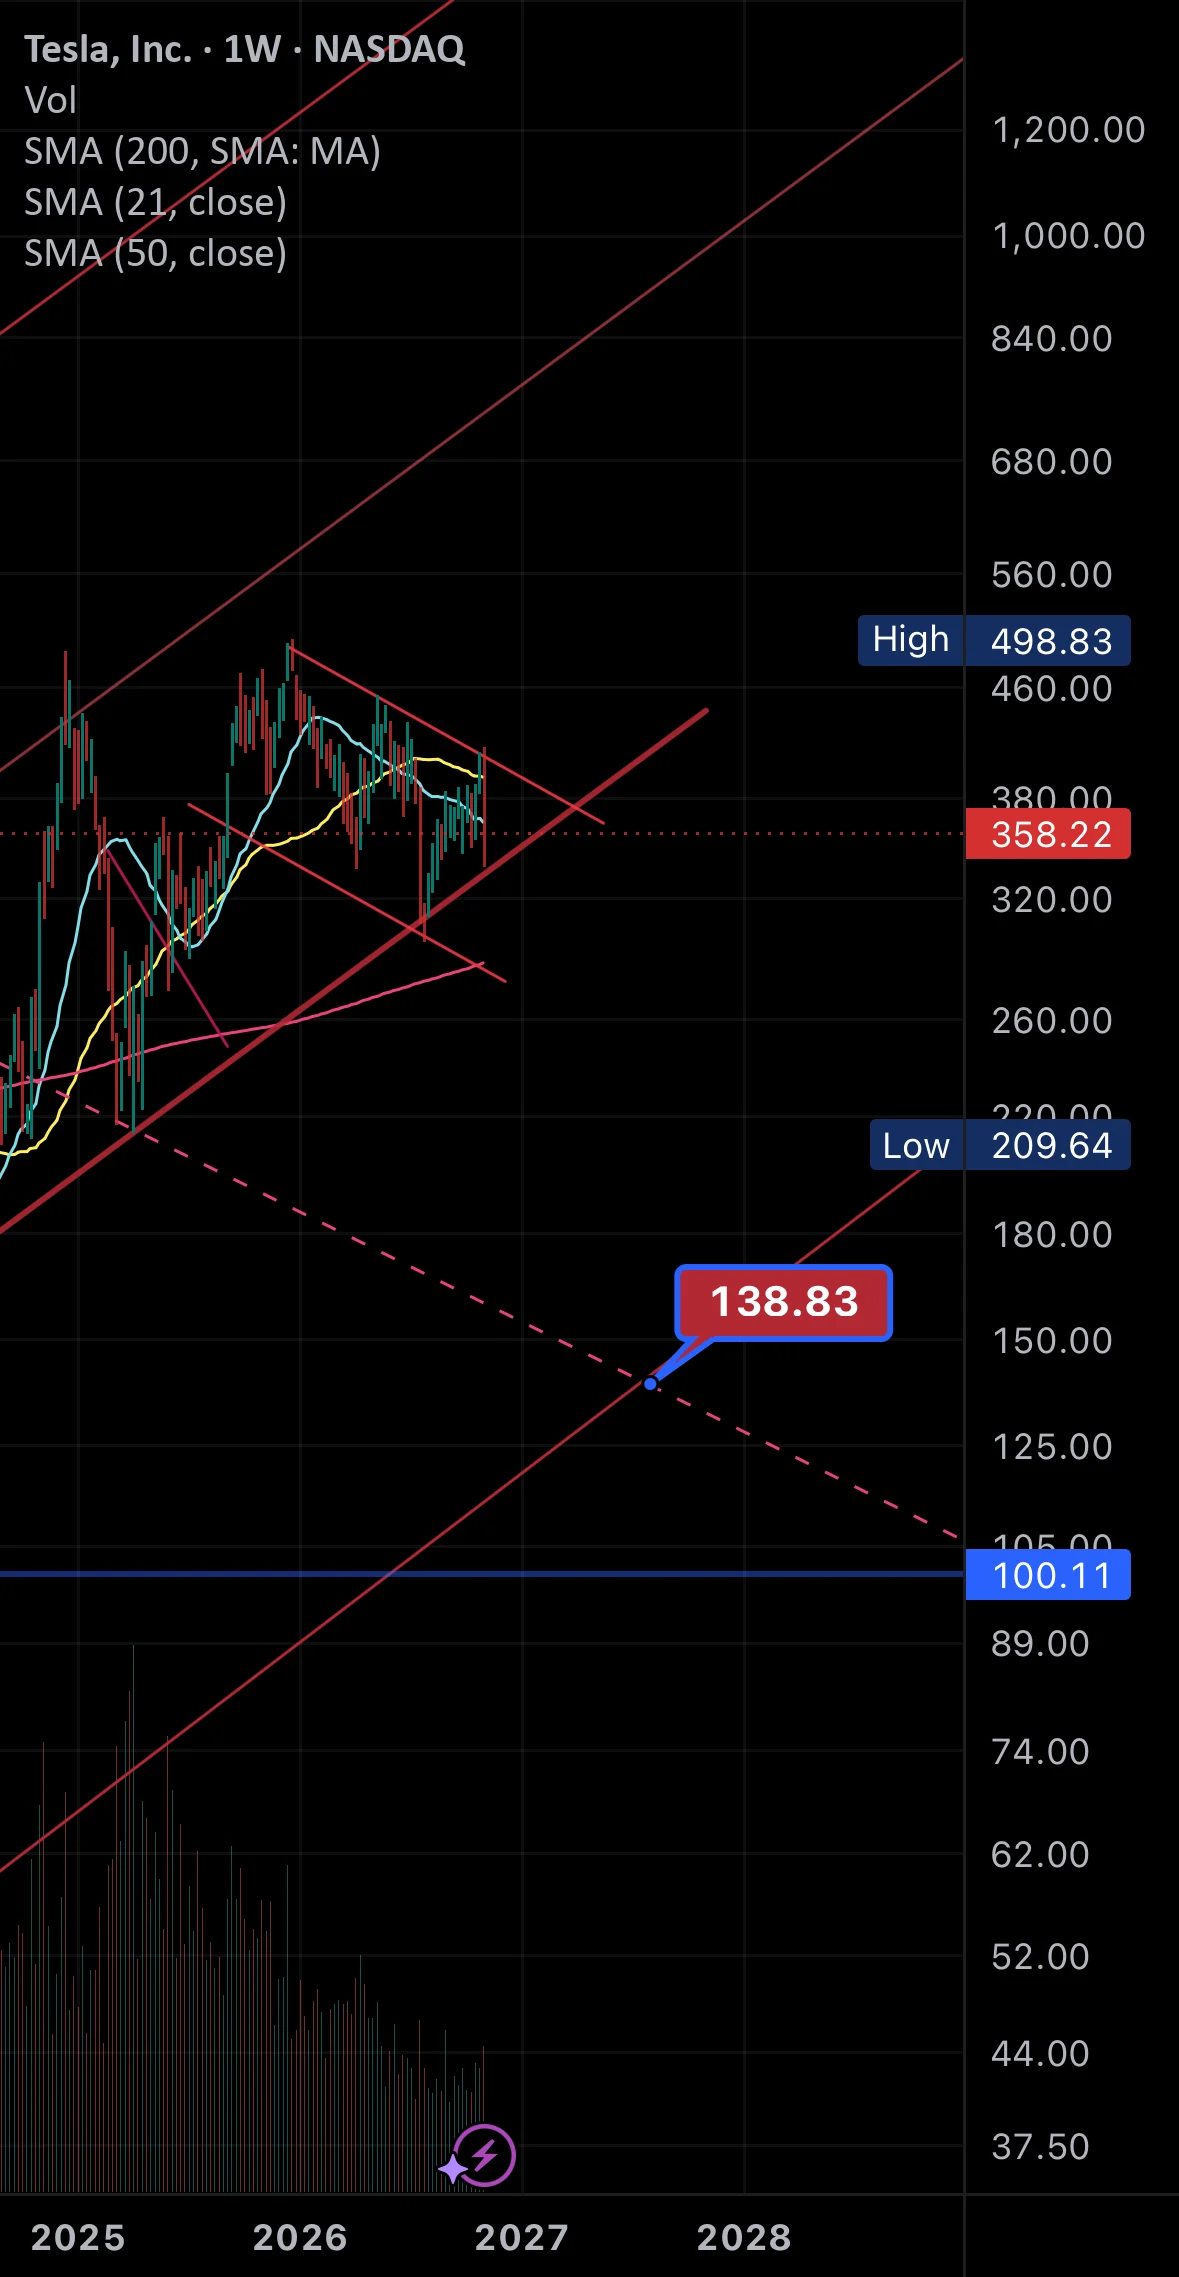
As financial markets continue to navigate periods of volatility, technical analysts and long-term market observers are reassessing the trajectory of some of the world’s most high-profile equities. Among them, Tesla Inc. remains a central focus for traders examining multi-year price charts, macro trends, and overarching market structures. In a recent market update shared via charting platforms, an experienced analyst has reiterated a long-standing projection regarding the electric vehicle pioneer, suggesting that the equity could eventually experience a significant correction toward the lower boundaries of its established multi-year trading channel.
The core thesis relies on macro technical analysis rather than complex fundamental breakdowns, pointing directly to historical chart patterns that the analyst claims to have first identified and shared approximately four years ago. According to this perspective, the overarching price structure of the stock suggests that a deeper retracement toward the $100 to $150 price range—or the ultimate bottom of the prevailing trading channel—remains a distinct probability over the medium term.
Proponents of this technical view argue that major market cycles often require deep corrections to flush out excessive leverage and retest foundational support levels before establishing a sustainable base for future secular bull markets. Within this analytical framework, the prospect of Tesla reclaiming and surpassing previous all-time highs, such as moving decisively beyond the $1,000 mark (pre-split adjusted equivalents or psychological milestones), may remain capped until the asset successfully tests and confirms the bottom of its broader trading range.
However, market dynamics are rarely dictated by technical indicators alone, and analysts routinely factor in fundamental wildcards that possess the capacity to instantly invalidate long-standing chart patterns. In this particular market outlook, a major structural catalyst has been identified that could completely disrupt the projected downward path: a potential corporate merger or consolidation between Tesla and SpaceX.
Such a corporate amalgamation would fundamentally alter the valuation model, revenue streams, capital structure, and investor sentiment surrounding Tesla. SpaceX, operating as a private aerospace manufacturer and satellite communications corporation with its own monumental valuation metrics and high-profile government and commercial contracts, would inject an entirely new set of fundamental variables into the equation. Should a merger materialize, the existing technical trajectory and predicted descent toward the $100–$150 channel bottom would be rendered obsolete, forcing market participants to recalibrate their models entirely around a newly formed, highly diversified conglomerate.
Absent such a monumental corporate restructuring, and assuming Tesla remains an independent, publicly traded entity operating within its current business model, the technical timeline points toward the summer months as a critical window for market action. The analyst responsible for the forecast notes that if the company continues on its current trajectory without structural interference from corporate mergers, the conditions could align by sometime this summer for the asset to finally test the anticipated "go long" target zone at the lower boundary of the channel.
Such a milestone would likely attract significant institutional attention, value investors, and long-term traders looking for historical support levels, potentially setting the stage for a major accumulation phase. As market conditions evolve, traders and investors continue to monitor both the technical charts and corporate developments closely to see whether the long-predicted channel bottom will materialize or if fundamental catalysts will alter the course of one of Wall Street’s most closely watched equities.
Disclaimer
The information and publications provided through these analytical updates are not meant to be, and do not constitute, financial, investment, trading, or other types of advice or recommendations supplied or endorsed by TradingView or affiliated publishing platforms. Market participants are always encouraged to conduct their own thorough research and consult with licensed financial professionals before making any investment or trading decisions.

Comments (0)