


Beyond the immediate financial figures, SEC filings reveal that NUAI has announced a major 20-year power agreement securing up to 207 megawatts of electricity. To put this scale into perspective, this capacity roughly equals the annual average electricity consumption of 170,000 American households. The power agreement is designed to support an ambitious Texas AI data-center project slated to come online in 2027. This data-center initiative is affiliated with Vistra (VST), one of the major electricity producers operating in Texas, and is officially named Texas Critical Data Centers (TCDC). When weighing these foundational developments and recent reports, market observers suggest that NUAI may increasingly attract investors looking toward its future positioning in the burgeoning AI infrastructure sector.
Technical Analysis
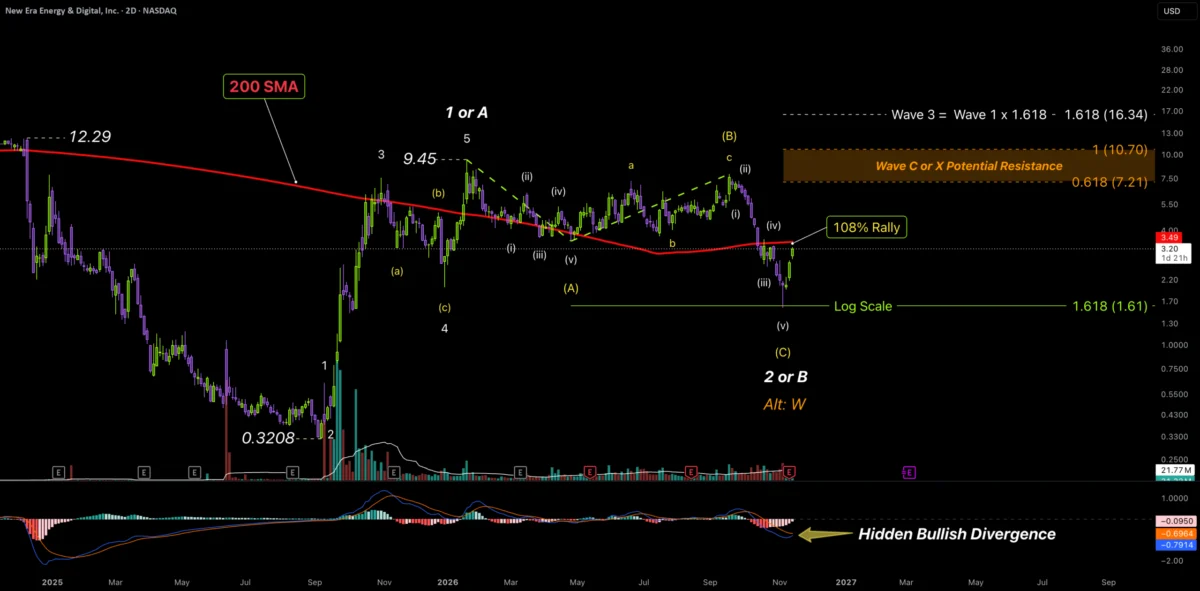
The broader market narrative surrounding NUAI requires a deep dive into its recent price action and historical volatility. The equity experienced a severe sell-off throughout 2025, shedding roughly 97% of its value from a December 2024 high of $12.29 down to a September 2025 low of $0.3208. Such a steep collapse often leads market participants to anticipate bankruptcy proceedings, and many observers naturally suspected a link to Chapter 11 restructuring. However, according to information provided by New Era, the company continued its regular business operations while executing a strategic pivot away from its legacy helium-based business model toward the rapidly expanding AI data-center infrastructure market, successfully remaining a publicly traded entity throughout the transition.
This successful and substantial corporate recovery eventually triggered a massive buying climax. The asset mounted an impulsive five-wave move to the upside, gaining approximately 2,840% over the span of roughly a third of a year, accompanied by significant volume spikes. Analysts note that it is fair to mark this primary rally as Wave 1 or Wave A, peaking at $9.45. Currently, there is not yet enough subsequent price action to definitively determine whether the unfolding structure will lead to a third wave of an impulse or a corrective third wave to the upside.
Within the correction that followed the initial peak at $9.45, price action appears to trace out a leading diagonal that marks yellow (A). This was followed by a corrective zigzag to the upside marking yellow (B), which subsequently gave way to an impulsive five-wave decline potentially marking yellow (C). Under this particular wave count scenario, yellow (C) equals yellow (A) multiplied by 1.618 on a log scale. This entire corrective sequence could potentially represent a completed, high-timeframe zigzag that marks Wave 2 or Wave B.
Currently, the price is testing the 200-day Simple Moving Average (SMA), while hidden bullish divergence is beginning to print on the charts. Although significant spikes in buying volume have not yet materialized, subtle technical signals are emerging on the 4-hour timeframe. A decisive break above the 200 SMA would significantly increase the probability of further upside continuation.
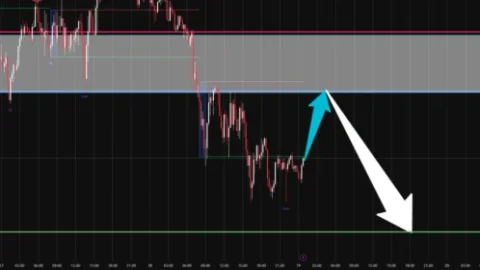
Market analysts acknowledge that it remains entirely possible for the current rally to function as part of a larger corrective wave. Viewed from this perspective, the ongoing advance could eventually be classified as Wave X, acting as a connective wave linking to an even more extensive correction. Alternatively, it could develop into Wave C, a phase where a robust five-wave impulse to the upside might be expected. Should the price push higher in the future and encounter resistance within the orange target zone—calculated using the 0.618 and 1.0 extensions of the second wave length compared to the first wave length—it could signal a high-timeframe corrective terminal to the upside, after which a substantial downward decline might follow.
Conversely, an alternate bullish interpretation treats the current rally as the early stages of Wave 3, potentially representing wave 1 of 3. If this scenario proves accurate, market participants could anticipate exceptionally strong buying pressure, a dramatic expansion in trading volume, and only minor, shallow pullbacks. A standard mathematical target for Wave 3 under this projection sits at $16.34, where Wave 3 equals Wave 1 multiplied by 1.618, or potentially even higher depending on the velocity of institutional capital inflows.
From a firmly bearish perspective, analysts also note the theoretical possibility that the completed yellow (C) structure marks only wave 1 of 5 down, which would imply extended price discovery to the downside. However, when taking into account the tangible operational fundamentals and utility of the TCDC project, most market analysts assign the lowest probability to this intensely bearish outcome, though it cannot be entirely ruled out.
Should New Era successfully execute its vision and develop into a world-class AI data-center infrastructure provider, current price levels may well represent the foundational beginning of a major multi-year market move. As always, market participants must conduct their own due diligence, as this overview is provided for informational purposes only and does not constitute financial advice.

Comments (0)