


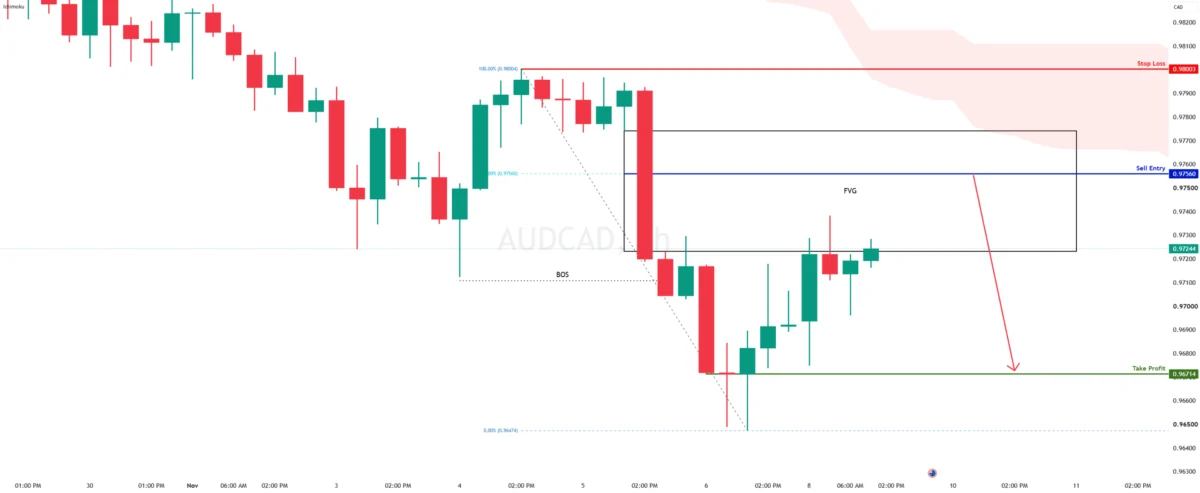
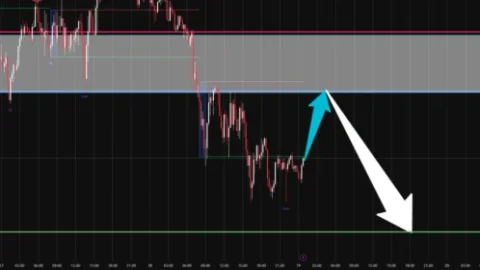
Recent technical market analysis indicates a prevailing bearish momentum for the AUD/CAD currency pair, as spot prices continue to trade firmly below the Ichimoku cloud structure. Market participants monitoring the currency pair are eyeing a potential short setup following a corrective pullback into key technical resistance levels that align with several traditional confluence indicators.
According to the latest setup details, analysts have identified a prospective sell entry at the 0.97560 price level. This specific entry threshold is supported by a confluence of technical factors, notably a pullback resistance zone, a 71% Fibonacci retracement level of the preceding swing move, and an identifiable fair value gap on the chart timeframe. These overlapping technical markers frequently attract seller interest during corrective upward movements within an established downward trend, serving as a focal point for market participants seeking to align with the broader market direction.
To manage risk effectively, the proposed strategy outlines a stop-loss placement at 0.98003. This level is situated just above established swing high resistance, offering a defensive buffer against potential market volatility or false breakouts that could invalidate the bearish thesis. On the downside, the primary take-profit objective is established at 0.96714, aligning closely with notable swing low support levels observed in recent price action. This target provides a balanced risk-to-reward ratio based on the structural boundaries of the current market range.
The analysis is presented against the backdrop of broad retail trading conditions and risk disclosure requirements governed by major regulatory bodies and financial service providers. Stratos Markets Limited, operating under the FXCM brand across various jurisdictions including the United Kingdom, Europe, Australia, and global entities, has reiterated standard risk warnings regarding derivative products such as Contracts for Difference (CFDs).
Financial regulators and providers emphasize that CFDs are complex instruments that carry a high risk of losing money rapidly due to the application of leverage. Statistical data provided by these institutions typically indicate that a significant majority of retail investor accounts—such as 65% of accounts reported by specific providers—experience financial losses when trading leveraged CFDs. Traders are consistently advised to evaluate whether they fully understand the mechanics of leveraged products and whether they possess the financial capacity to absorb the high risk of capital loss. In certain jurisdictions, such as under Stratos Global LLC, market losses can even exceed initial deposits, underscoring the necessity for rigorous risk management protocols.
The underlying technical commentary and market ideas featured in platforms like TradingView are frequently supplied by independent third-party providers, such as TFA Global Pte Ltd, rather than the execution brokers themselves. Financial institutions and platforms routinely issue reminders that end users bear sole responsibility for any trading decisions executed on their personal accounts.
Analyses, charts, and technical insights disseminated across these networks are intended strictly for research, educational, and informational purposes. They do not constitute formal investment advice, financial consultation, or a tailored investment strategy. Because the information provided is generalized, it does not take into account the unique investment objectives, financial situations, risk appetites, or specific needs of individual viewers or recipients.
Furthermore, market participants are reminded that past performance serves as an unreliable indicator of future results. Actual financial outcomes and market movements may differ substantially from those anticipated in forward-looking statements or historical performance reviews. Major brokerage entities and third-party data providers assume no liability regarding the accuracy or completeness of the analytical content supplied, nor can they be held responsible for any omissions, errors, or consequential financial losses—including lost profits—that might arise from reliance on third-party market insights.
Integration features between charting platforms like TradingView and execution brokers such as FXCM allow market participants to monitor and follow technical analyses directly from their interactive charts. However, traders engaging in foreign exchange and CFD markets are continually encouraged to review comprehensive legal documentation, including Product Disclosure Statements, Financial Services Guides, Target Market Determinations, and prevailing Terms of Business provided by their respective regulated entities before committing capital to active positions.

Comments (0)