


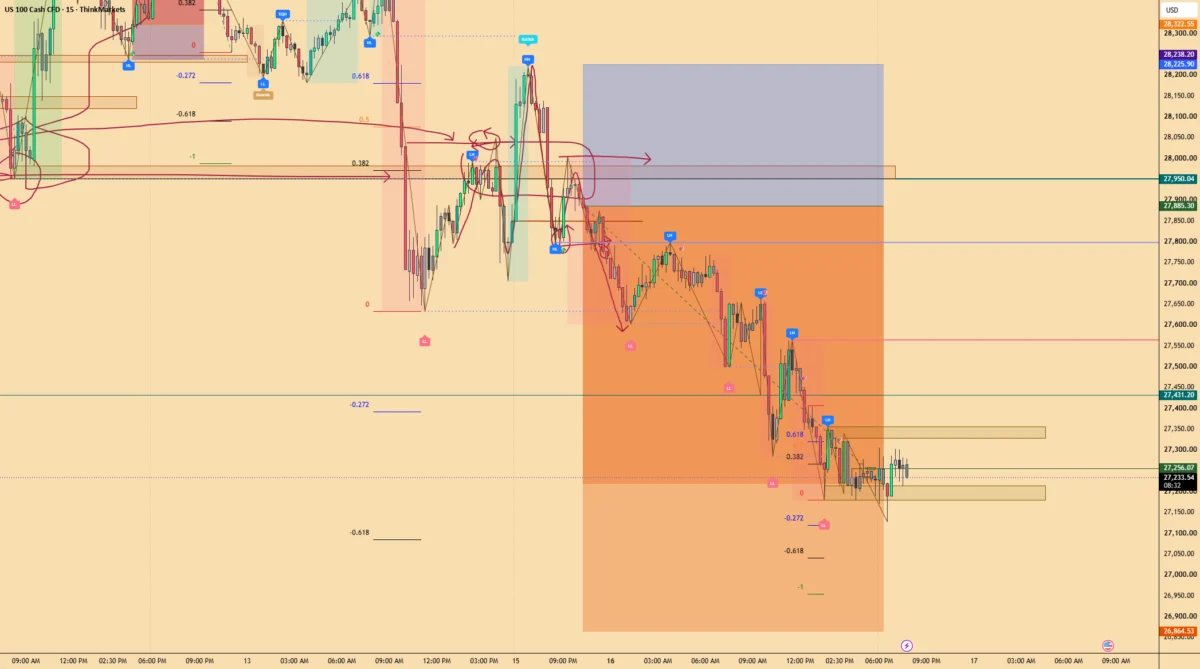
In the fast-paced world of index trading, market participants are constantly searching for methods to bridge the gap between long-term macro trends and precise trade execution. A recent market breakdown shared by a professional trader illustrates this exact challenge, offering a detailed look at how a short position on the Nasdaq 100 index (NAS100) was constructed by systematically stepping down from the monthly chart all the way to a 15-minute execution window.
The analytical process begins at the highest level of market architecture, the monthly timeframe. According to the breakdown, the broader structural bias on the monthly chart for the NAS100 remains fundamentally bullish. However, even within a dominant multi-year upward trend, major financial markets experience healthy corrections and corrective pullbacks. Recognizing this distinction allows a trader to respect the overarching momentum while still identifying localized opportunities to profit from downward price swings.
Moving down to the weekly and daily timeframes, the market structure began to reveal signs of exhaustion. The weekly and daily charts showed that a significant swing high was currently forming, signaling that the ongoing upward momentum was encountering heavy resistance and potentially running out of steam. To gain a clearer, more granular view of the selling pressure developing beneath that major high, the analysis shifted down to the intermediate 4-hour timeframe.
At the 4-hour level, the market provided the initial structural confirmation needed to validate the bearish bias. The price action failed to print a new higher high, a critical warning sign for an established bullish trend. Following this failure, the index closed decisively below its previous higher low. This shift in market structure—often referred to by price action practitioners as a change of character—prompted the trader to drop down further to the 1-hour chart to observe how the momentum was accelerating.
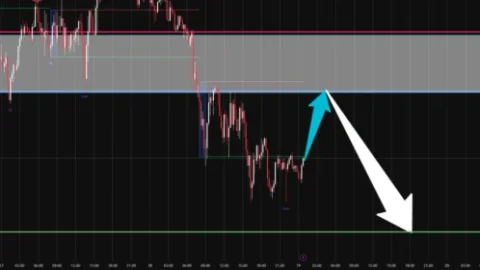
Once the hourly timeframe began breaking down in tandem with the 4-hour chart, the setup entered its final preparation phase. The focus shifted to the 15-minute chart to pinpoint the exact entry for the short position. Interestingly, the immediate behavior of the 15-minute chart was initially bullish, demonstrating the complex nature of navigating lower timeframes while higher trends are shifting.
During this phase, the price briefly broke above an established resistance level, creating a temporary bullish trap. However, the momentum quickly reversed as the price dropped back below the resistance zone and failed to reclaim it on a subsequent retest. Seizing upon this rejection, the trader entered the short position on the formation of a lower high, placing the initial protective stop-loss safely above the recent 15-minute high to manage risk effectively.
Following the execution of the trade, the NAS100 entered a consolidation phase, trading in a defined range between a recent low and a subsequent lower high. Current price action displays a series of equal lows, yet the overhead lower high remains unbroken, leaving the immediate next directional move unconfirmed by the market. Despite the ongoing consolidation, the trade management strategy has already adapted to secure open profits. The stop-loss order has been adjusted and is currently positioned in profit, resting safely above the prior lower high to protect accumulated gains regardless of how the near-term range resolves.
This comprehensive market breakdown highlights the practical application of multiple timeframes in modern technical analysis. By systematically following price action from the macro perspective of the monthly chart down to a tactical 15-minute entry, market participants can navigate complex trends without needing to rely on hyper-fast intraday intervals like the 5-minute chart. The approach underscores the value of patience, structural confirmation, and disciplined risk management in index trading.
Disclaimer
The information and publications are not meant to be, and do not constitute, financial, investment, trading, or other types of advice or recommendations supplied or endorsed by TradingView.

Comments (0)