


In the evolving landscape of modern financial technical analysis, market participants continually seek advanced methodologies to decode institutional trading behavior. Among the various analytical frameworks gaining prominence on major charting platforms, Smart Money Concepts—commonly referred to as SMC—have emerged as a central pillar for traders analyzing price action across equities, derivatives, and digital assets. Within this specialized analytical ecosystem, identifying significant structural shifts remains a primary objective for professionals aiming to align their positioning with institutional capital flows.
At the heart of this analytical approach is the concept known as a Break in Market Structure, or BMS. This technical indicator serves as a critical signpost for analysts, identifying moments when price action penetrates a previously established swing high or swing low. By highlighting these structural breaches, market participants can better gauge whether a prevailing trend is likely to continue or if a fundamental shift in market direction is underway. As financial markets grow increasingly complex, understanding these underlying structural mechanics provides a clearer lens through which to view institutional accumulation and distribution phases.
Defining the Mechanics of Market Structure Breaks
To comprehend how a Break in Market Structure functions within SMC analysis, one must first examine the fundamental architecture of price swings. A BMS essentially materializes when price successfully breaches a significant structural threshold, signaling a decisive move by dominant market participants. Depending on the trajectory of the market, these structural breaks are categorized into distinct directional classifications.
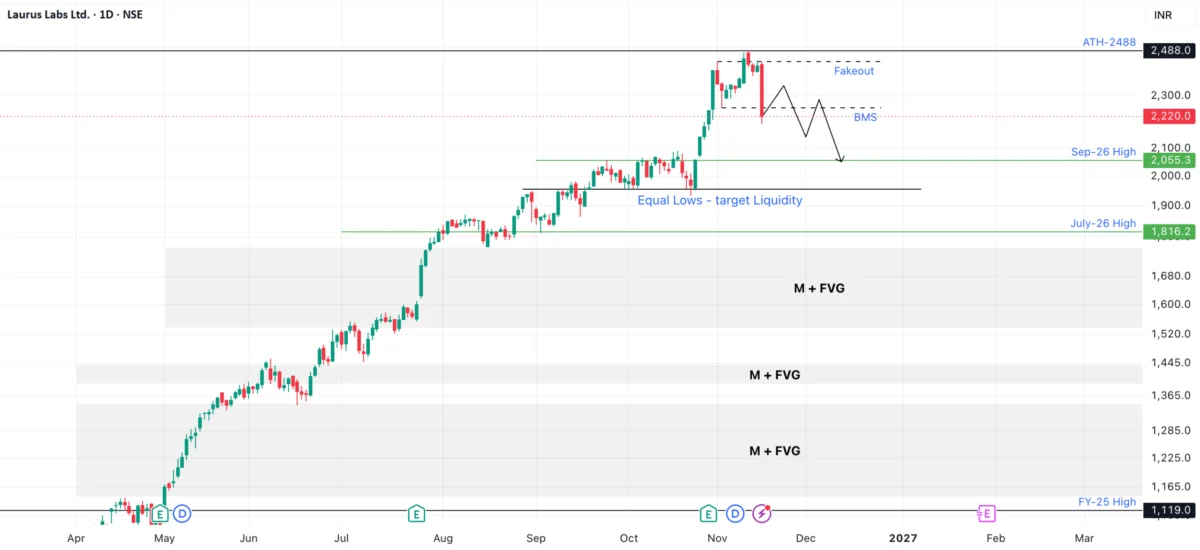
In a bullish context, a market structure break occurs when the price action decisively moves above a preceding swing high. This upward violation indicates strong buying pressure and a willingness by institutional participants to absorb supply at higher price levels. Conversely, a bearish BMS is identified when the price action breaks below a preceding swing low. This downward breach highlights aggressive selling pressure and a lack of demand at structural support levels, pointing toward potential continuation of a downward trend or an emerging bearish phase.
The formation of a bullish market structure is typically preceded by a specific sequence of price movements. Initially, the market generates a higher high, followed by a subsequent pullback that establishes a higher low. Once the price ascends and decisively breaks above the prior swing high, a bullish BMS is officially confirmed. Within the SMC framework, this confirmation often prompts analysts to monitor for potential buying opportunities, particularly when the market undergoes a successful breakout followed by a corrective retracement.
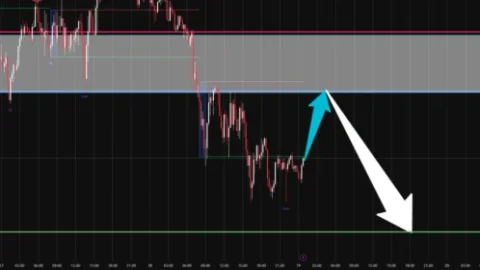
A corresponding yet inverse sequence defines the bearish market structure. The process begins when the price prints a lower low, followed by a corrective pullback that creates a lower high. When the price subsequently breaks below the prior swing low, a bearish BMS is validated. Following this breakdown, market participants utilizing these concepts frequently look for selling opportunities, anticipating that the corrective retracement will offer favorable risk-to-reward entry parameters in alignment with the newly confirmed downward momentum.
Comparative Terminology and Structural Variations
Navigating the terminology associated with Smart Money Concepts can present challenges, as definitions and acronyms often vary significantly among trading educators and independent analysts. To establish a standardized understanding, market practitioners frequently differentiate between several closely related structural terms, each serving a unique analytical purpose in deciphering price action.

A Break in Market Structure is primarily utilized to identify structural breaks that signal continuation or trend validation. In contrast, a Shift in Market Structure, often abbreviated as SMS, is frequently employed to denote broader directional shifts within the prevailing trend. Meanwhile, a Change of Character, widely recognized by the acronym CHoCH, is traditionally interpreted as an early warning signal of a potential trend reversal, often occurring before a definitive structural break takes place.
Additionally, analysts frequently reference a Break of Structure, or BOS, which is widely used in various price-action methodologies to signify the continuation of an ongoing trend. While these terms share overlapping characteristics regarding price movement across swing highs and lows, their specific interpretations can vary depending on the analytical school of thought. Analysts must therefore remain cognizant of these subtle semantic differences when evaluating commentary and technical setups across different charting communities and educational platforms.
Implementing Structural Setups in Professional Analysis
Translating the theoretical framework of market structure breaks into an analytical routine involves a structured sequence of observations across multiple timeframes. Professional analysts utilizing Smart Money Concepts typically begin their assessment on a higher timeframe, such as the one-hour chart, to establish the prevailing market trend and delineate important swing highs and swing lows.
Once these foundational structural levels are established, the analytical focus shifts toward observing how price interacts with these zones. Analysts wait for a strong candle close that decisively penetrates the structural level, confirming the integrity of the break rather than a temporary wicking action. Following this confirmation, practitioners often identify key institutional zones, specifically focusing on Order Blocks and Fair Value Gaps, which represent areas where significant institutional orders were previously placed or left unmitigated.
The analytical process then involves monitoring price as it retraces toward these identified Order Blocks or Fair Value Gaps. Rather than entering positions immediately upon the initial structural break, professionals frequently wait for lower timeframe confirmation, such as on the five-minute or fifteen-minute charts, before finalizing their market bias. Risk management parameters are subsequently established by placing invalidation levels—commonly managed via stop-loss orders—beyond the structural threshold that would negate the current setup. Finally, projected price targets are typically aligned with the next available liquidity pool, where resting orders from other market participants are likely concentrated.
As with all technical analysis and trading strategies, engaging with financial markets involves substantial risk. Market conditions are inherently unpredictable, and analytical frameworks such as Smart Money Concepts are designed solely for educational and informational purposes. They do not constitute financial, investment, or trading advice, nor do they guarantee future performance in any asset class.

Comments (0)