


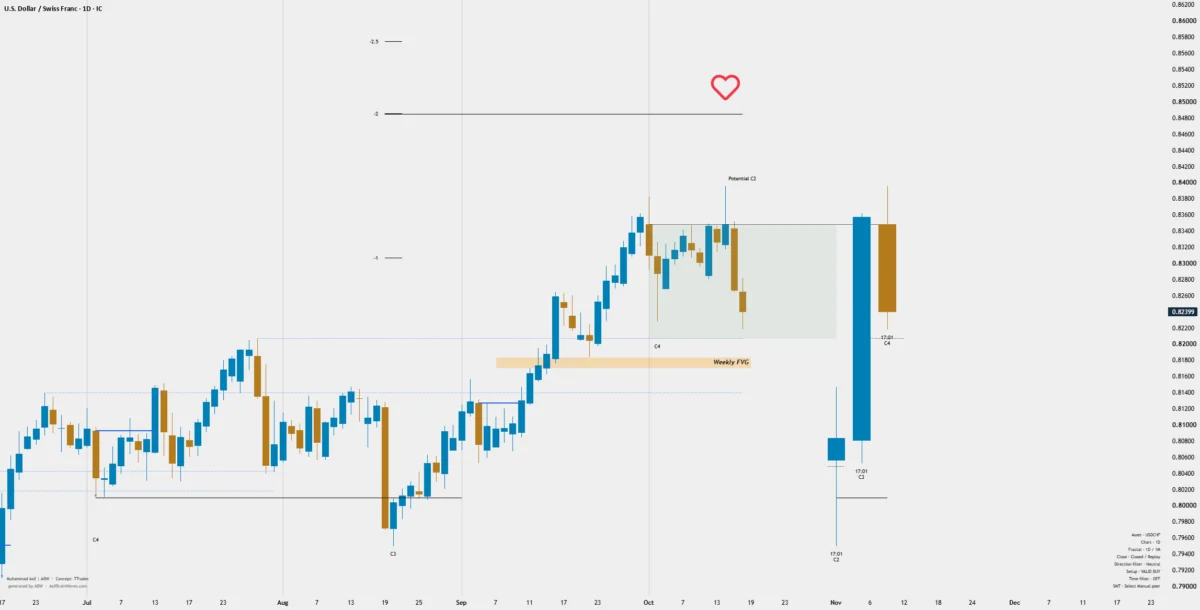
The USD/CHF currency pair is currently navigating a critical juncture on its daily chart, capturing the attention of technical analysts monitoring complex market structures. Following a robust bullish expansion that carried prices from the 0.8050 region up to the 0.8350 threshold, the pair has encountered a notable bearish reaction near its upper boundary. This recent price behavior has introduced a state of neutral market bias, prompting traders and analysts to carefully evaluate whether the prevailing bullish market structure can be sustained or if the market is preparing for a deeper retracement phase.
At the heart of this technical evaluation is an advanced fractal model framework. The daily chart highlights distinct formations labeled as C2, C3, and C4, which collectively map out the intricate relationship between market liquidity, price displacement, and overall price delivery. Understanding these structural reference points has become essential for market participants attempting to anticipate the next major directional move in the Swiss franc relative to the US dollar.
Fractal Model and Market Structure Dynamics
The core of the current technical setup rests on the identification of specific fractal formations that delineate market boundaries and behavioral shifts. The recent price action saw a powerful upward impulse beginning near the 0.8050 support area, culminating in a test of the 0.8350 resistance zone. However, the subsequent bearish rejection from these upper levels has raised immediate questions regarding the durability of the current bullish cycle.
Analysts are closely monitoring the interaction between price and these structural markers to determine if the market is forming a lasting top or merely consolidating before another leg higher. Rather than assuming that any single fractal formation is fully complete upon initial touch, technical strategies emphasize the importance of monitoring liquidity interactions and waiting for concrete confirmation from subsequent price bars.
Analyzing the C2, C3, and C4 Structural References
Within the framework of the daily fractal model, specific alphanumeric classifications provide a historical roadmap of the chart’s structural sequence. The C2 formation is currently marked near the upper price boundary, spanning approximately the 0.8350 to 0.8400 range. This zone represents a primary area of interest where institutional liquidity is frequently pooled, making it a critical litmus test for bullish momentum.
Lower down in the price structure, the legacy of previous C3 and C4 annotations continues to offer valuable context. Of particular importance to the current market configuration is the most recent C4 region, which is situated between 0.8200 and 0.8210. Market observers note that this band acts as a crucial line in the sand. A sustained breakdown beneath this specific structural reference would signal underlying market weakness, substantially increasing the statistical probability that the exchange rate will drift lower toward higher-timeframe support zones.
The Significance of the Weekly Fair Value Gap
Should the pair break down below its immediate structural supports, attention will inevitably shift toward a major higher-timeframe reaction zone: the Weekly Fair Value Gap (FVG), located between 0.8170 and 0.8180. This region is widely regarded by technical practitioners as a pivotal crossroads for the medium-term trajectory of USD/CHF.
Within this overarching framework, two primary scenarios are currently under observation. The first is a bullish continuation scenario. Under this outlook, if the price successfully respects and holds the Weekly Fair Value Gap, and a fresh bullish market structure subsequently develops, the pair could stage a robust recovery back toward the 0.8340 to 0.8350 resistance band. A confirmed, high-volume breakout above that stubborn resistance area would subsequently open the door for a broader advance toward the 0.8480 to 0.8500 psychological and technical region.
Conversely, the bearish scenario is equally defined. A decisive and confirmed loss of the Weekly Fvg support level would severely undermine the prevailing bullish thesis. Such a breakdown would expose the pair to extended selling pressure, leaving lower support around the 0.8140 mark exposed as the next logical target for market bears.
Evaluating Fractal Model Indicators and Market Sentiment
To complement visual chart inspection, technical indicators applied to the USD/CHF daily timeframe currently display a specific configuration that highlights the nuanced nature of the market. The setup is formally flagged as a valid buy signal, yet the underlying direction filter remains in a neutral state, while the time filter is switched off.
Market experts emphasize that the presence of a valid buy label in isolation does not constitute a green light for an immediate market entry. Because the directional filter is currently neutral, traders place an elevated level of importance on genuine price reactions and definitive structural confirmation before committing capital. The market is effectively waiting for validation from the charts, balancing the potential for an upward continuation against the risk of a deeper corrective pullback.
As the session progresses, focus remains squarely on how the price action interacts with the established fractal formations, the crucial Weekly FVG, and the upper liquidity and resistance zones. With the technical landscape finely balanced, market participants continue to monitor price delivery closely to see which structural path USD/CHF ultimately chooses to confirm.
The fractal model concepts referenced in this analysis originate from the work of TTrades. The chart interpretation and commentary have been conducted independently by Asif Brain Waves (ABW), with no institutional affiliation or formal endorsement implied. This material is published strictly for educational and informational purposes and does not constitute financial or trading advice.

Comments (0)