


Silver prices experienced a notable pullback during today’s trading session, sliding from recent highs as part of a routine market correction. However, despite the downward pressure currently affecting a wide swath of the broader financial and commodity markets, the precious metal’s 4-hour (4H) chart structure continues to maintain a clearly defined and resilient bullish bias. Market participants and technical analysts monitoring the white metal are closely evaluating key price zones to determine whether the current retracement is merely a temporary pause within a broader ongoing uptrend or the precursor to a deeper test of primary demand levels.
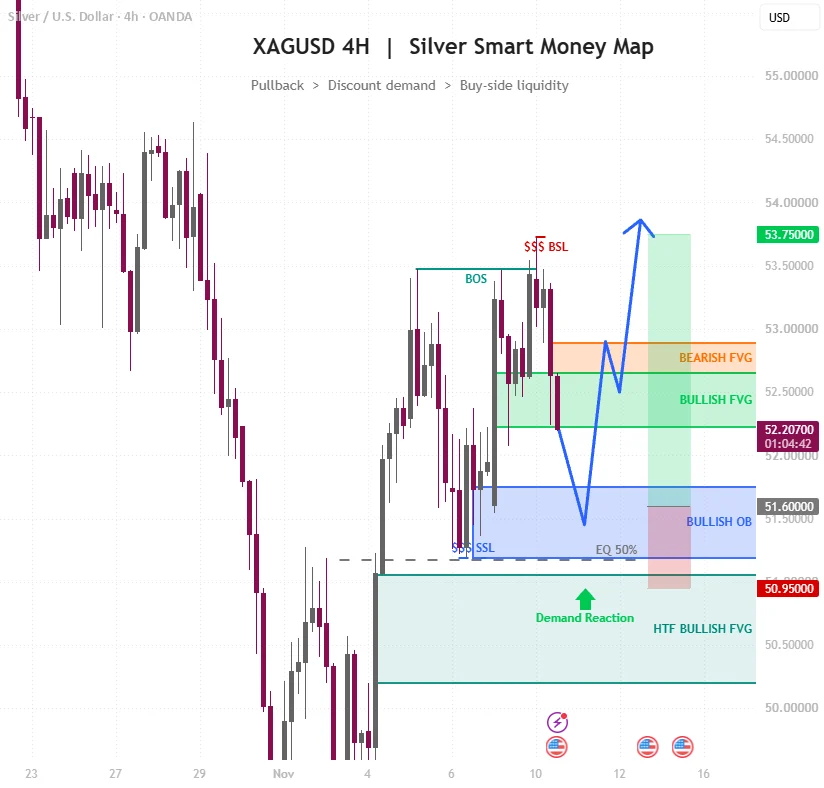
To understand the current technical landscape, traders are relying on a detailed price action map that outlines the defining boundaries of the prevailing trend. The foundation of this bullish structure was cemented during the early part of November, when market momentum shifted decisively. Specifically, on November 9, price action forcefully broke above the previous high established on November 5 at the 53.48 level, printing a textbook Break of Structure (BOS). This aggressive upward surge culminated in the printing of a higher high at 53.73. Market technicians emphasize that as long as the critical swing low established on November 6 at 51.19 remains intact and successfully defends against aggressive selling pressure, the current downward movement can be interpreted strictly as a healthy, standard pullback occurring within the confines of a larger, established macro uptrend.
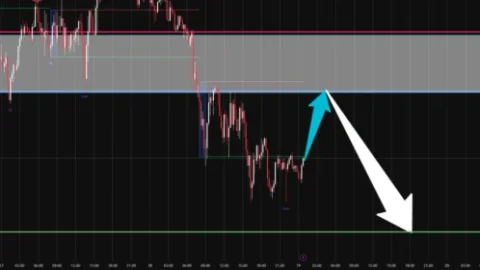
Analyzing the immediate price landscape requires a careful examination of both premium and discount zones relative to the current market price. Looking first at the premium territory located directly above current price levels, market analysts have identified a significant bearish Fair Value Gap (FVG) ranging from 52.65 to 52.89. This particular imbalance zone was left behind in the wake of today’s downward price acceleration and represents the primary overhead area where sellers are expected to mount a defense or attempt to cap any upcoming relief bounces. Just above this immediate resistance zone lies the most recent swing high at approximately 53.73, which acts as the primary repository for buy-stop liquidity. The accumulation of buy stops resting directly above this milestone high serves as the most obvious and logical upside target for the next impulsive leg up should the broader bullish momentum resume.
Conversely, looking below current market prices into the discount territory reveals several vital layers of institutional support and demand. Immediately below the market, a bullish Fair Value Gap spanning from 52.23 to 52.65 is currently being tested by incoming sellers. Market observers note that a swift and decisive hold within this specific zone would represent the most aggressive bullish scenario, signaling strong underlying buyer interest before prices can drift any lower.
Further down lies a more substantial institutional footprint: a bullish Order Block (OB) ranging from 51.19 to 51.75. This specific zone marks the institutional base that initiated the powerful rally seen on November 6, making it the primary demand zone for swing traders and longer-term market participants. A particularly strong confluence of technical factors converges at the absolute bottom of this demand zone. The swing low of November 6 at 51.19 aligns almost perfectly with the 50 percent equilibrium level of the entire macro price leg measured from the 48.62 low to the 53.73 high, which sits at approximately 51.17. This heavy clustering of technical support creates a formidable technical floor that is expected to attract significant buying interest. In the event that this primary Order Block fails to halt the downward momentum, market participants are keeping a watchful eye on a deeper Higher Timeframe (HTF) bullish Fair Value Gap positioned between 50.20 and 51.05, which represents the ultimate line of defense for the broader uptrend.
Market participants tracking these developments are currently focusing on a specific multi-step price action scenario to guide their near-term positioning. The primary sequence under observation begins with the possibility that price action fails to hold the immediate bullish Fair Value Gap currently undergoing a test, resulting in a deeper rotation downward into the 51.19 to 51.75 Order Block zone. Should price successfully pierce this deeper demand region, traders will look for a pronounced bullish reaction or a localized lower-timeframe structural shift within that discount zone to confirm that institutional buyers are stepping in to absorb the remaining supply. The final phase of this anticipated roadmap involves a subsequent rotation back upward through the 52.65 to 52.89 resistance band, ultimately culminating in an aggressive drive to sweep the buy-stop liquidity resting above the 53.73 high.
Within the context of active risk management and chart planning, a hypothetical trade setup derived from this structural analysis outlines a specific framework. Such a plan might contemplate a market entry around the 51.60 level near the upper bounds of the demand cluster, paired with a calculated invalidation point positioned safely below the structural lows at 50.95. The target for this illustrative setup is mapped out near the 53.75 threshold, yielding an estimated risk-to-reward ratio of approximately 1 to 3.3. However, analysts emphasize that market conditions remain fluid, and strict risk parameters are mandatory given the inherent volatility of precious metals trading.
The overarching integrity of the current bullish thesis relies heavily on the defense of these established technical thresholds. Market specialists warn that a confirmed 4-hour candle close below the crucial invalidation level of 50.95 would formally break the prevailing bullish structure, neutralizing the near-term upside outlook and immediately opening the door for a deeper descent into the aforementioned higher-timeframe Fair Value Gap located between 50.20 and 51.05.
As silver navigates this pivotal juncture, market sentiment remains divided on whether the precious metal possesses the immediate strength to stabilize and hold the current Fair Value Gap, or if a deeper correction and a thorough test of the underlying order block will be required before the next major directional move unfolds. As always, technical assessments of this nature reflect individual charting perspectives intended for educational and analytical purposes within the broader financial community, requiring market participants to maintain disciplined risk management protocols amidst evolving macroeconomic and trading conditions.

Comments (0)