


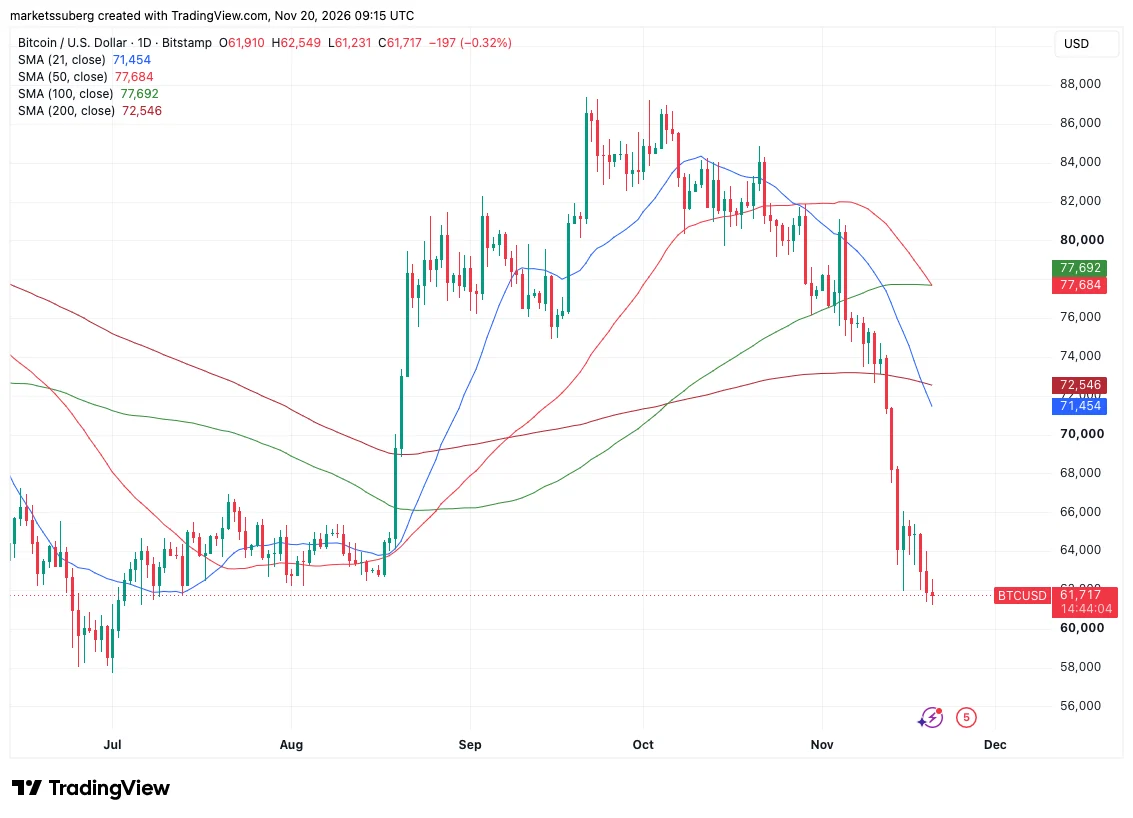
Bitcoin (BTC) could be on the verge of repeating a rare pair of bearish moving-average crossovers that previously preceded its dramatic retest of the $25,000 support level back in September 2023, according to fresh insights shared by veteran market analyst Keith Alan.
The cryptocurrency market has faced mounting headwinds in recent weeks, and technical indicators are beginning to flash warning signs that resemble past historical corrections. While past performance is never a definitive guarantee of future price action, analysts are closely monitoring these unfolding trends as macroeconomic pressures and shifting market dynamics weigh heavily on digital assets.
Alan Says Bitcoin’s Crossover Pattern ‘Should Not Be Ignored’
Fresh analysis from Keith Alan, cofounder of crypto trading platform Material Indicators, draws a direct comparison between the current Bitcoin chart setup and a strikingly similar market structure observed during the late-summer and autumn months of 2023.
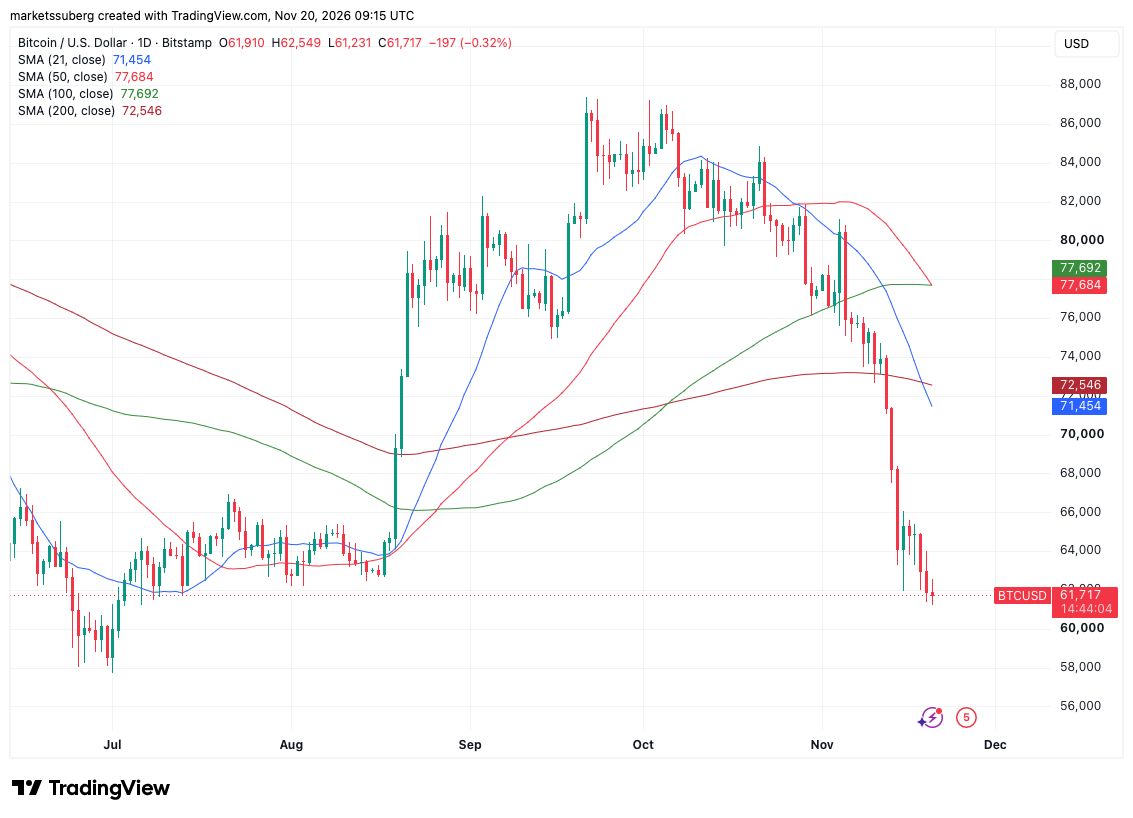
On Bitstamp’s BTC/USD daily chart, the 21-day simple moving average (SMA) crossed decisively below its 200-day equivalent. This particular technical shift last occurred in early November, arriving roughly one month after Bitcoin recorded its latest all-time high of $126,200, marking the early developmental stages of the current broader market correction. Compounding the bearish pressure, the 50-day SMA crossed below the 200-day SMA later that same month, cementing a conventional "death cross" pattern on the daily timeframe.

Looking ahead at the immediate market trajectory, Alan expects the 50-day SMA to cross below the 100-day SMA before the conclusion of the week, adding further weight to the shifting momentum indicators.
"We’ve only seen this happen once before in Bitcoin’s history, and it should not be ignored," Alan summarized in a detailed post shared on the social media platform X.
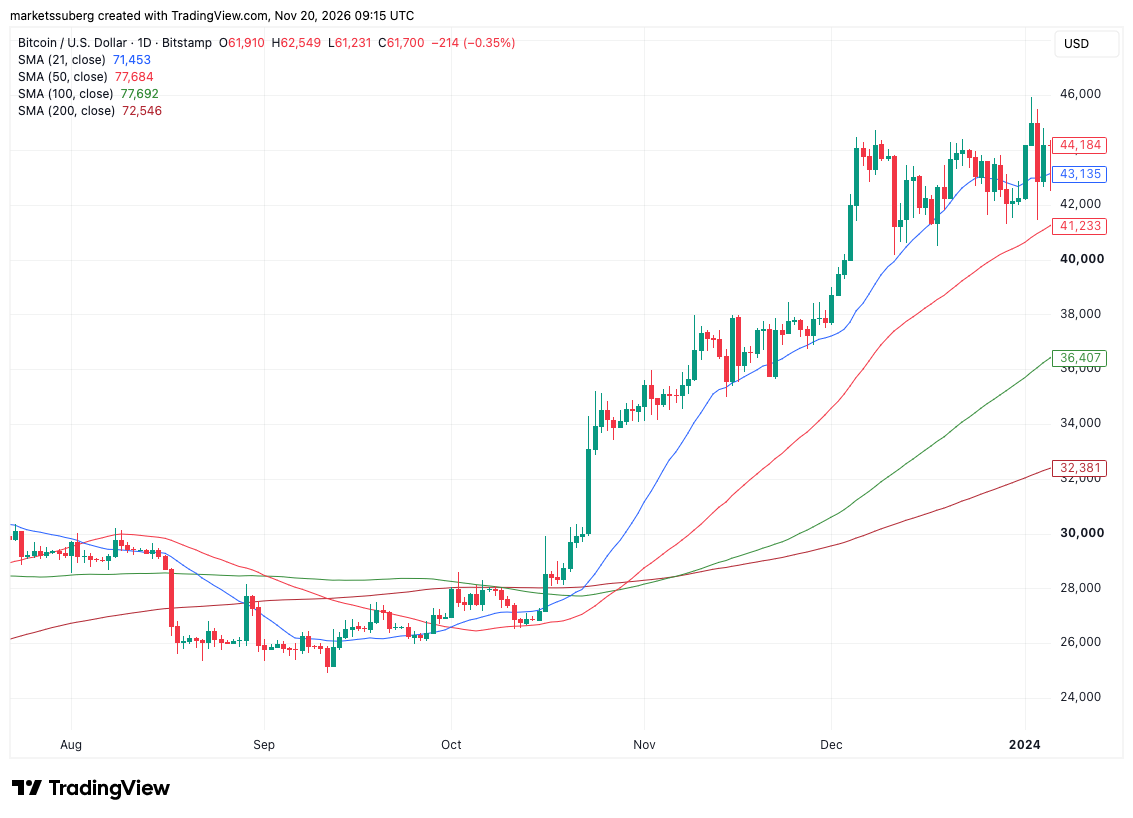
Historical data shows that the only other time in Bitcoin’s existence where these two specific pairs of moving averages both produced a death cross formation within the same general timeframe occurred between August and September 2023. Following that sequence, the BTC/USD trading pair experienced a prolonged downward slide before finally retesting its crucial local support level near $25,000 on September 11 of that year.
Rather than spelling long-term doom, Alan has described that specific 2023 market structure as a classic double-bottom formation that ultimately laid the groundwork for a massive, sustained relief rally. That subsequent upward surge drove Bitcoin all the way up to its yearly high of $44,700 by early December, translating to an impressive 80% price increase from the lows.
Despite drawing these compelling technical parallels, the analyst remains measured in his near-term market expectations. "One occurrence is by no means a large enough sample to consider a reliable pattern, or expect similar returns and drawdowns," Alan noted. "However, the timing, placement, and candle characteristics have enough similarities that we can’t ignore it either."
BTC Price Hits New 20-Week Low Near $61,200 Amid Broader Market Turbulence
The technical warnings come hot on the heels of broader structural weakness across the crypto market. Earlier reports highlighted that Bitcoin had lost crucial support at its 200-week simple moving average for the first time since mid-August. In technical analysis, this long-term trend line typically functions as a reliable safety net of support during bull-market retracements, but it frequently flips to act as formidable overhead resistance when the asset attempts to recover from positions below it.
The cascading technical breakdowns culminated on Friday when the BTC/USD pair dipped to a multi-week low of $61,231. This marks the lowest price level recorded for the flagship cryptocurrency since July 3, underscoring a swift and aggressive cooling-off period following months of heightened market speculation and institutional participation.
The latest leg down in the crypto market also coincided with broader turbulence in traditional financial sectors. Bitcoin’s sharp drop followed closely on the heels of a landmark event on Wall Street: Anthropic’s record-shattering initial public offering and subsequent debut on the Nasdaq exchange.
The tech-heavy Nasdaq Composite Index endured a brutal trading session, finishing down 2.25% at 23,879 points to close out the week at its lowest daily level since April 14. The spillover effect from technology stocks heavily impacted sentiment across risk-on asset classes, creating a challenging environment for digital assets as well.
Market participants watched closely as Anthropic shares traded sharply lower following their initial public launch. After reaching a daily peak of $115, the stock experienced a steep pullback, closing out Thursday’s session at $97.17 before dropping further to trade around $91.50 ahead of Friday’s opening bell. The 20% retracement from its intraday high rattled equity investors and injected fresh volatility into correlated growth markets, dragging cryptocurrencies down alongside high-flying tech equities.
As the weekend approaches, market analysts and traders remain vigilant. With technical indicators signaling rare historical parallels and macroeconomic factors driving broader risk aversion across global financial markets, the path forward for Bitcoin will largely depend on its ability to defend crucial psychological and technical support zones in the face of mounting selling pressure.




Comments (0)