


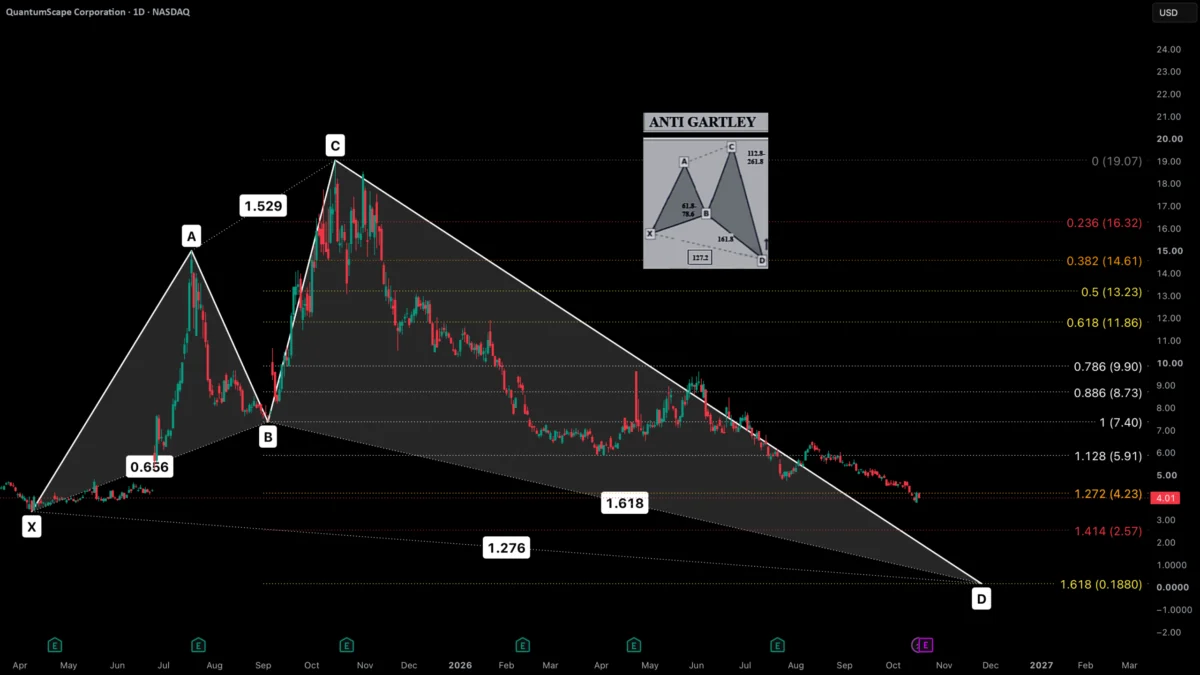
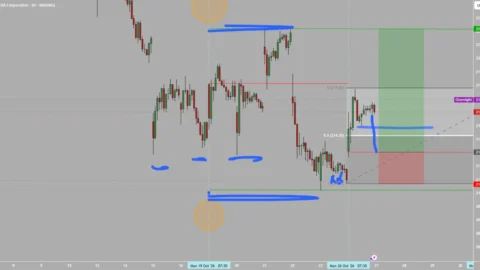
Market watchers and technical analysts are keeping a close watch on QuantumScape Corporation (QS) as the stock approaches a pivotal technical juncture. According to market participant and analyst azda71, who has been monitoring a specific harmonic price structure on the asset since June 27, the stock is now standing at a crucial crossroad that could dictate its intermediate-term price trajectory. The observation, recently shared across financial analysis platforms, underscores the delicate balance currently facing the high-profile battery technology company’s shares on the open market.
The central thesis of the recent observation revolves around harmonic price patterns, a sophisticated form of technical analysis used by traders to identify potential trend reversals based on geometric price structures and Fibonacci ratios. In this framework, price movements are categorized into specific legs or waves, culminating in designated reversal zones often labeled with letters such as X, A, B, C, and D. According to the shared analysis, QuantumScape has been tracking precisely along one of these calculated harmonic pathways for well over a month, giving technical traders a structured lens through which to view the stock’s recent volatility.
However, this extended tracking period has brought the security to an inflection point. The analyst notes that if QuantumScape fails to generate upward momentum from its current price levels, the equity faces a genuine and mounting technical risk of declining further into the ultimate completion zone of the pattern, commonly referred to in harmonic methodology as the D point. In technical analysis, the D point represents the potential reversal zone where supply and demand dynamics are expected to shift significantly, but reaching it from the current setup would imply a continuation of downward pressure on the stock.
Adding urgency to this technical outlook is the stock’s recent interaction with specific Fibonacci extension levels. The analysis points out that QuantumScape has already encountered rejection at the 1.272 Fibonacci extension level. In technical trading circles, a rejection at a key extension level typically indicates that buying pressure has temporarily exhausted itself, allowing sellers to regain control and push prices back down toward established support parameters. This failed attempt to sustain higher valuations at the 1.272 threshold has amplified concerns among market participants who rely on harmonic structures to gauge short-term sentiment and momentum shifts.
The implications of this technical setup extend beyond mere chart geometry, reflecting broader market sentiments surrounding development-stage clean technology firms. Companies like QuantumScape, which focus on the intensive research and commercialization of next-generation solid-state lithium-metal batteries for electric vehicles, often experience heightened volatility driven by both macroeconomic conditions and speculative trading activity. Technical indicators such as harmonic patterns frequently capture these swings, offering traders a systematic way to interpret psychological and behavioral patterns in the order book.
As is standard practice across reputable financial information networks, commentary of this nature is accompanied by essential disclaimers regarding the nature of market analysis. The insights shared by market participants regarding QuantumScape’s technical formation are intended strictly for informational and educational purposes. They do not constitute formal financial, investment, trading, or other types of advice or recommendations supplied, endorsed, or validated by hosting platforms or financial institutions. Observers and retail market participants alike are continually reminded that technical patterns are probabilistic rather than predictive, and individual investment decisions should always align with comprehensive personal risk management strategies and independent research.
For now, all eyes remain fixed on how QuantumScape’s shares will behave around these crucial technical boundaries. Whether the stock can muster the necessary buying support to invalidate the downside risk or whether it will ultimately retrace toward the anticipated D point remains one of the more closely monitored developments among technical traders tracking the equity this season.

Comments (0)