


In 1906, Upton Sinclair went undercover in Chicago’s grueling meatpacking plants to expose the stark, brutal realities of industrial poverty. His landmark work, The Jungle, immortalized a world of overcrowded squalor, hazardous child labor, and a ruthless economic system that maimed workers and discarded them without a safety net.
Fast forward to 2025, and the modern digital landscape has introduced a very different kind of data-driven muckraker: Michael W. Green, an asset manager whose recent viral thesis claimed that American families earning less than $140,000 are living in poverty.

The assertion quickly spread across social media platforms, leaving casual observers to marvel at how modern households allegedly manage to survive on such meager six-digit incomes. By Green’s strict logical framework, a staggering two-thirds of all American households should arguably be eligible for immediate federal food assistance.
Unlike Sinclair, however, Green does not appear to have spent time embedded with the working- and middle-class families he purports to champion. Had he stepped away from his analytical models to engage with everyday households, he might have recognized the immediate disconnect between his spreadsheets and reality. Economists and data analysts who specialize in parsing macroeconomic trends have been virtually unanimous in their swift rejection of Green’s viral thesis.
Scott Winship dismissed the analysis on Substack, calling it “the worst poverty analysis I have ever seen.” Prominent economist Tyler Cowen echoed those sentiments in a piece for The Free Press, noting that Green’s study is fundamentally flawed across the board, from its underlying concepts and granular details to its selective use of evidence. Jeremy Horpedahl similarly characterized the premise as ridiculous, while Noah Smith argued that Green fundamentally misinterprets his own numbers, labeling the overarching conclusions as deeply silly.
While Green has attempted to address some of these sharp critiques in follow-up commentary, observers note that one hardly needs advanced academic credentials to spot the flaw. The intuitive reality remains that no family pulling in $139,000 annually is facing genuine destitution or going hungry.
To be fair, Green’s broader argumentation introduces a layer of nuance, heavily citing frameworks like MIT’s "cost of thriving" index. This index attempts to measure economic health by calculating the weeks of median male earnings required to maintain a standard of living over time—estimating, for instance, that it took roughly 30 weeks of median earnings in 1985 compared to 63 weeks today.
Yet, looking backward through the lens of modern consumption reveals a different story. Anyone old enough to have experienced the mid-1980s can observe that everyday life is objectively easier and economically superior today. While the cultural artifacts of the 1980s—ranging from cinema and music to fashion—might hold a distinct nostalgic charm, the physical reality of consumer goods has transformed entirely.
Today, automobiles, household appliances, power tools, consumer electronics, and staple goods are vastly superior in quality. In nearly all categories, they are also significantly cheaper when adjusted for quality improvements.
Even housing and healthcare have undergone profound transformations that raw inflation metrics often fail to capture. As Tyler Cowen points out, while housing costs have visibly risen, the average American today enjoys significantly more living space than ever before, alongside fewer co-habitants per household.
The trend in healthcare is perhaps even more striking. Rather than being purely inflationary, the broader trajectory of modern medicine has been deflationary in terms of utility—meaning the cost of purchasing an extra expected year of human life has steadily declined over the decades. Put simply, modern healthcare at current prices offers vastly better outcomes than the medical care of previous generations ever could.
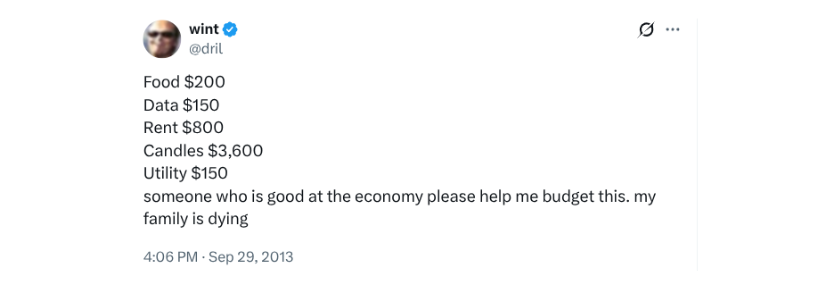
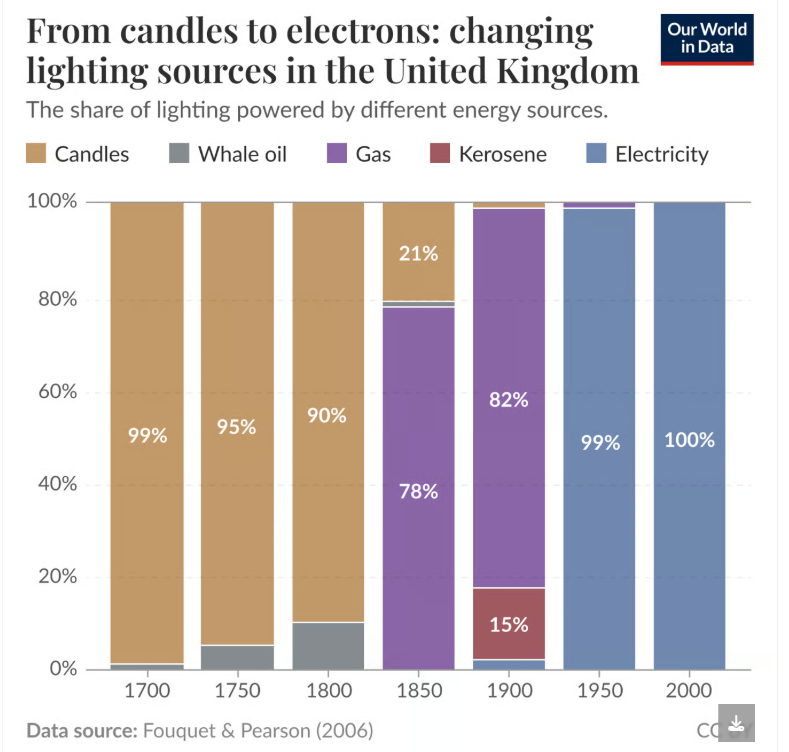
This core realization—that surface-level statistics frequently miss massive improvements in the actual purchasing power of a dollar—has deep roots in economic history. Nobel laureate William Nordhaus famously demonstrated this principle by evaluating the historical cost of lighting measured in lumens. By tracking lumen-hour costs across candles, kerosene lamps, and modern electric bulbs, Nordhaus exposed how traditional economic measures severely underestimate true progress when they ignore qualitative advancements.
In 1800, generating enough light to illuminate a room for three hours required roughly three hours of manual labor. Today, that same illumination requires only a fraction of a second of work—representing an astonishing 43,000-fold improvement in efficiency that official GDP statistics and standard consumer price indices miss entirely.
Nordhaus’s broader point is that technological advancement is rarely captured fully by standard economic indicators, leading society to chronically underappreciate how far living standards have advanced. Conversely, ignoring quality improvements leads to absurd outcomes, akin to evaluating the modern cost of living as if consumers were still forced to buy 19th-century lighting technology at historical prices, leaving them with nothing left over for modern essentials like housing, automobiles, or advanced healthcare.
Critics argue that Green falls into this exact statistical trap by analyzing modern spending on vastly superior goods and services without accounting for the exponential value consumers receive in return. As Cowen concludes, high prices are frequently a symptom of high demand, which can only occur when a larger share of the population has the purchasing power required to participate in the market.
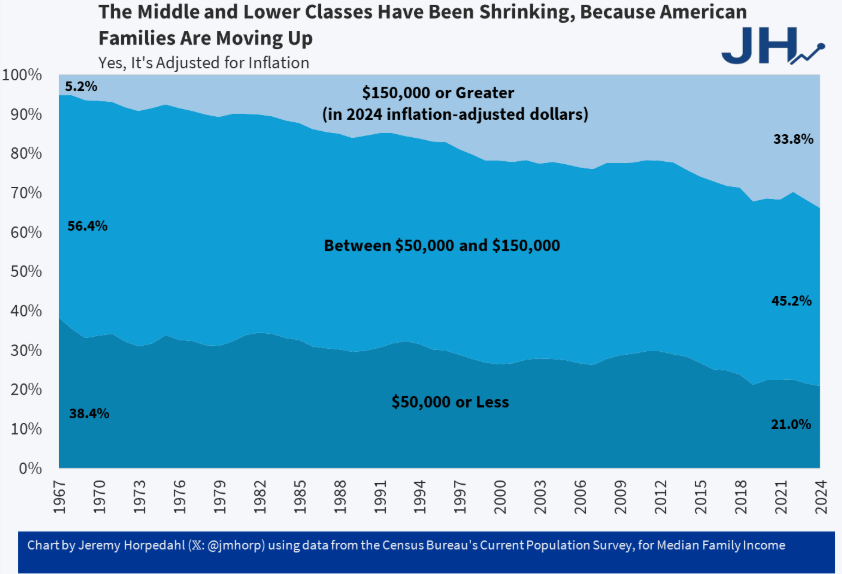
A closer examination of long-term economic data underscores this broader narrative of upward mobility. The composition of American household income has shifted dramatically upward over the decades. In 1967, only 5.2 percent of US families earned over $150,000 in inflation-adjusted terms; today, nearly 34 percent of families cross that threshold.
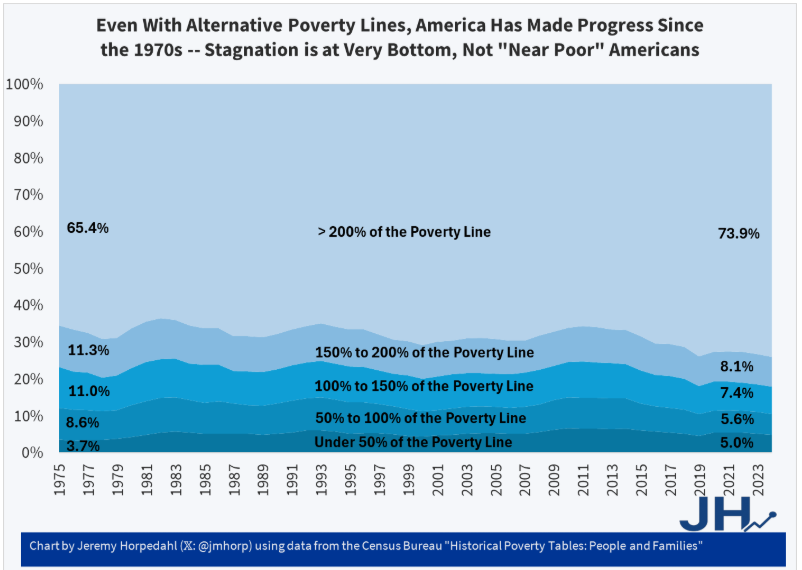
Simultaneously, the broader population has steadily climbed out of lower-income brackets. The percentage of Americans living in households with incomes exceeding 200 percent of the federal poverty line—roughly $60,000 for a family of four—has risen by 8.5 percentage points since 1975.
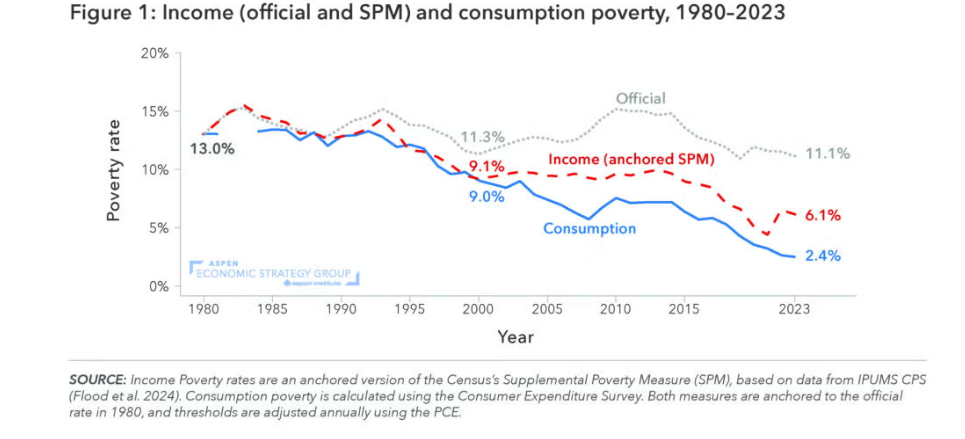
Alternative economic metrics confirm that poverty is steadily declining. Research from the Economic Strategy Group demonstrates that poverty rates have fallen by roughly half when measured via traditional income-based models, and by more than 80 percent when evaluated through consumption-based metrics. In both instances, the real-world reduction in hardship far exceeds what standard government statistics indicate.
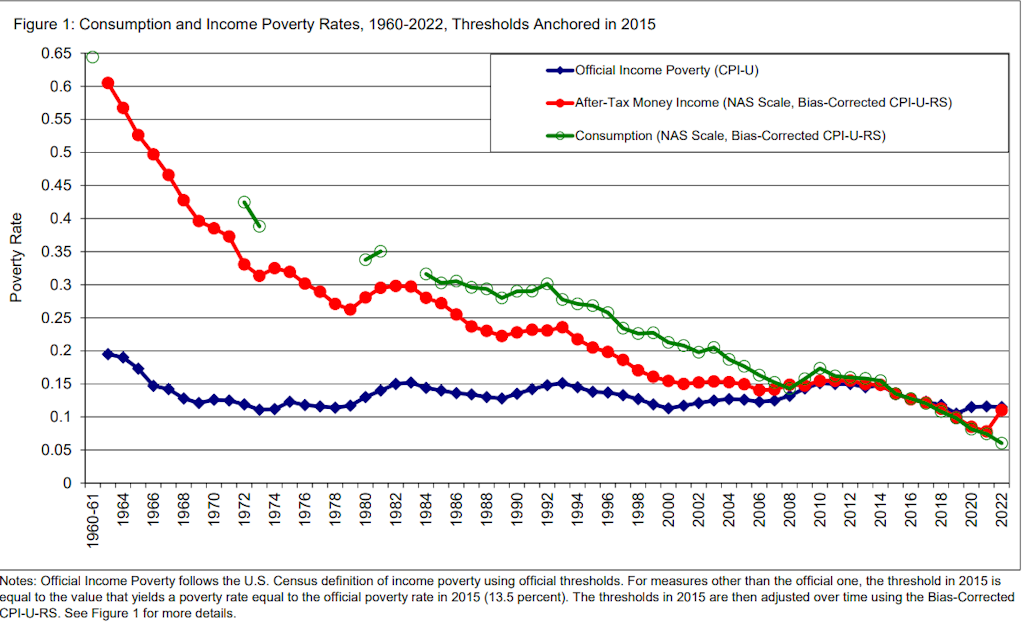
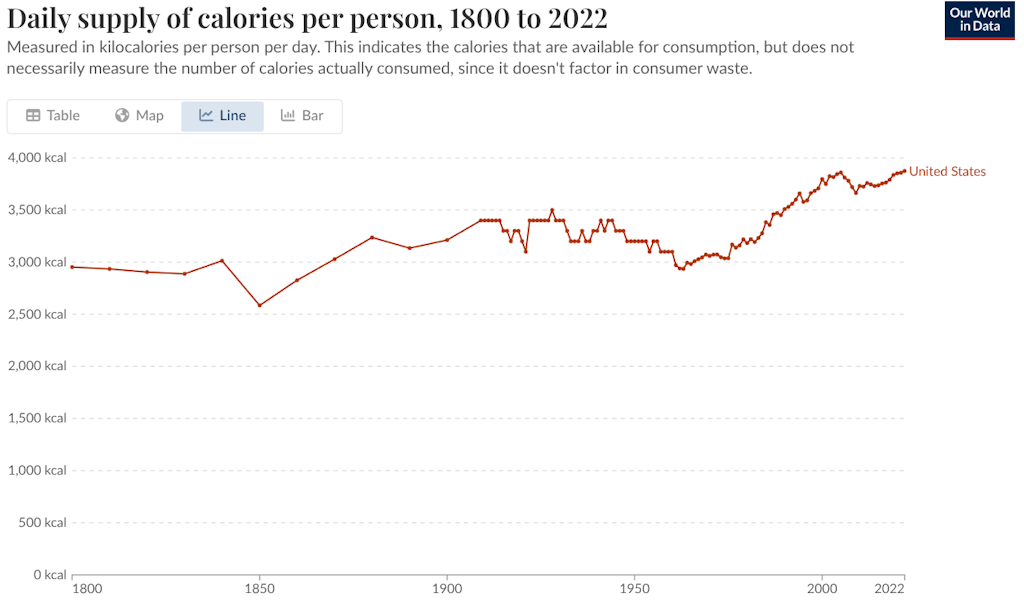
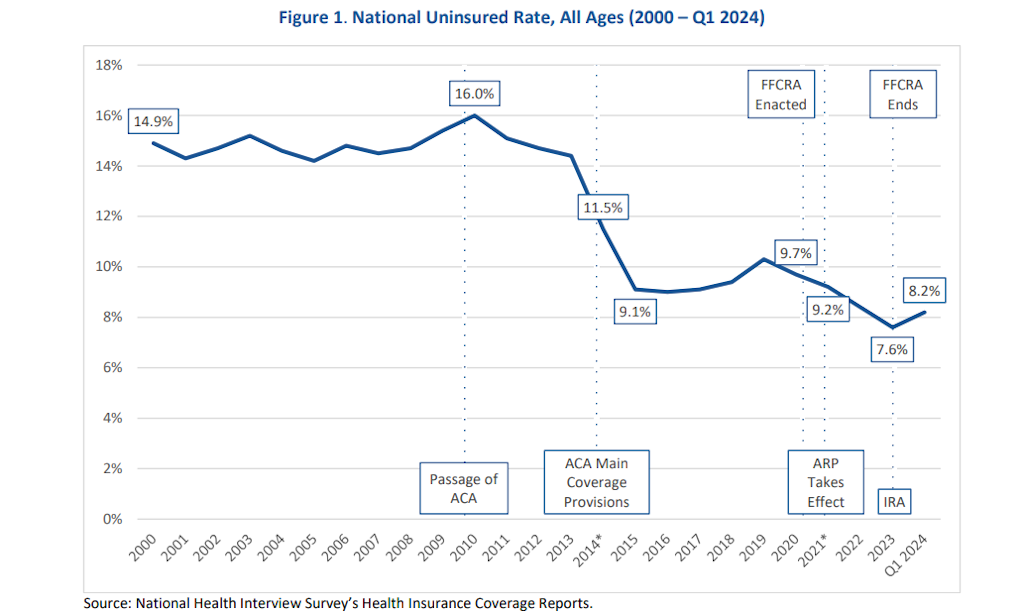
Academic studies tracking consumption poverty and after-tax resources reveal that the official Consumer Price Index-based measures of poverty consistently fail to capture decades of material improvement. Daily calorie consumption, for instance, sits at roughly 3,800 calories per capita—about 15 percent higher than levels recorded in 1985. Meanwhile, the uninsured rate across the United States dropped to 8.2 percent in 2024, down sharply from 16 percent in 2010.
These milestones reflect an economy where goods once considered extreme luxuries have become universally accessible. As historical data reminds us, candles were once so expensive in the 19th century that mariners risked their lives hunting whales across dangerous oceans simply to secure lighting fuel. By contrast, a million lumen-hours of light—roughly equivalent to running an ordinary household light bulb continuously for two months—cost the equivalent of $52,000 in the year 1300. Today, the time-price of that same light has collapsed from three hours of manual labor in 1830 to a fraction of a second.





Comments (0)