



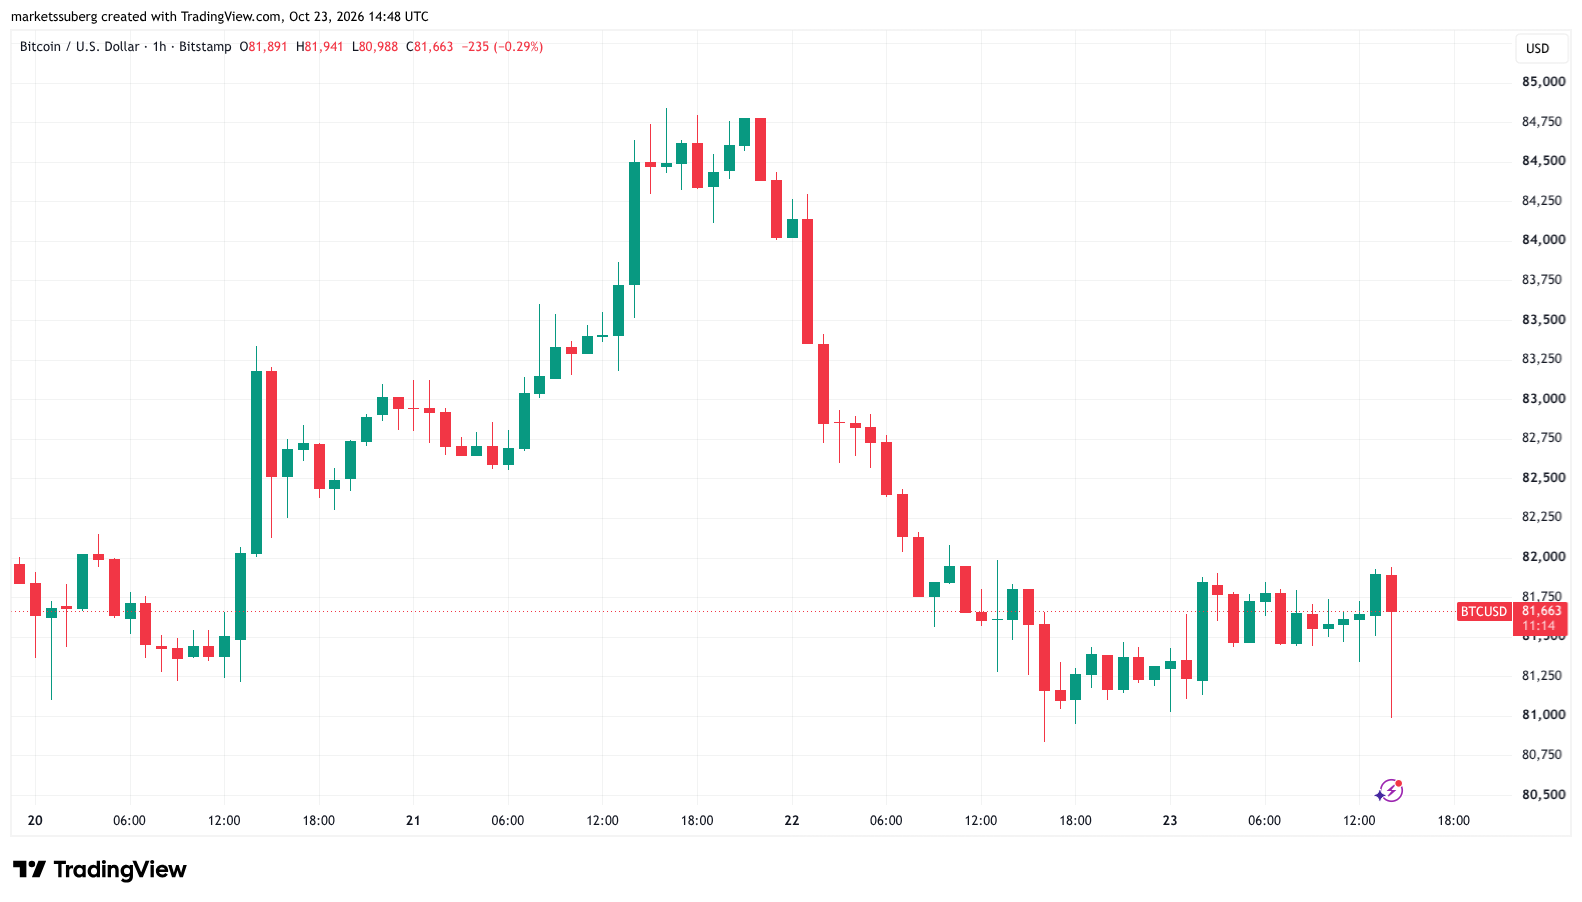
Bitcoin saw a fresh wave of downward pressure, slipping below the $81,000 threshold following Friday’s Wall Street opening bell. The cryptocurrency’s latest pullback arrived concurrently with global energy markets reacting sharply to geopolitical escalations, pushing Brent crude oil to new seven-month highs and dampening risk appetite across broader traditional financial sectors.
Data provided by TradingView captured the immediate market reaction, showing the BTC/USD trading pair sliding to an intraday low of $80,988. Although bulls managed a modest recovery attempt shortly afterward, bringing the asset back to hover around the $81,600 mark at the time of writing, the broader macroeconomic landscape continued to exert heavy influence over crypto price action.

The latest crypto market weakness was part of a synchronized downturn across global risk assets. US stocks opened lower on Friday as a combination of lingering artificial intelligence sector expenditure worries and escalating geopolitical friction collided. Market participants found themselves navigating a complex web of economic anxieties, primarily stoked by renewed tensions surrounding a potential US-Iran conflict.
These geopolitical fears triggered a broad flight to safety, or at least a temporary retreat from high-beta assets. Major Wall Street indices reflected the risk-off sentiment clearly. The tech-heavy Nasdaq Composite Index slipped 0.2%, while the broader S&P 500 recorded a 0.6% decline. The Dow Jones Industrial Average suffered a more pronounced retreat, trading down 1.4% as traditional equity investors reassessed their exposure heading into the weekend.
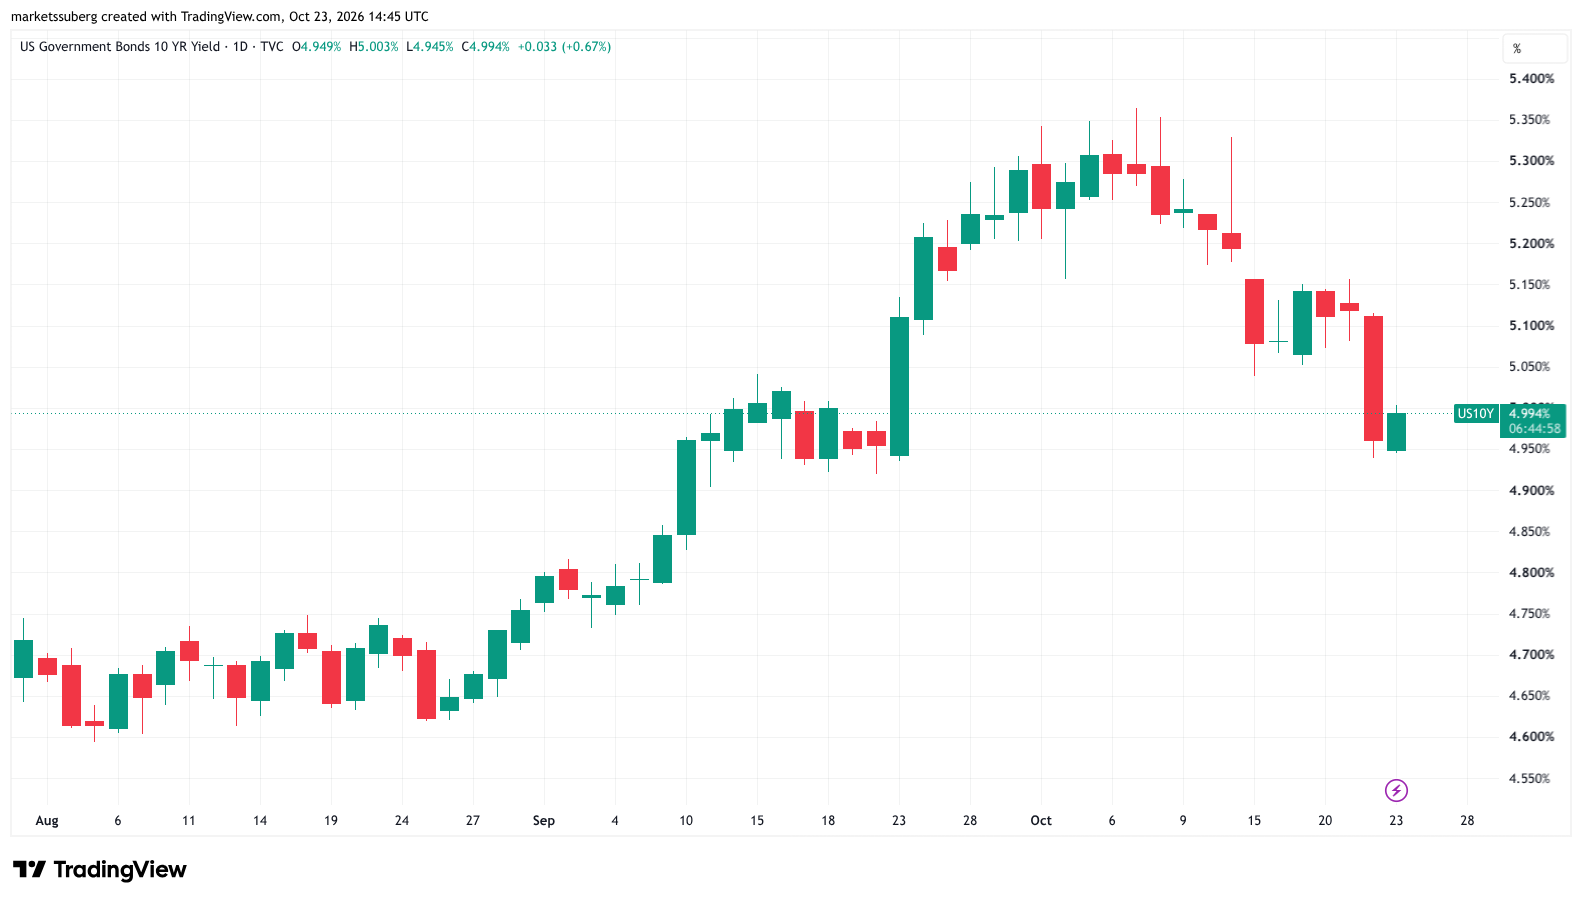
Amid the flight from equities, fixed-income markets also experienced notable shifts. The 10-year US bond yield managed to stay below the psychological 5% threshold, having touched 4.939% on Thursday—marking its lowest level since September 23. This movement in bond yields underscored the defensive posture adopted by institutional traders attempting to hedge against mounting macroeconomic uncertainty.
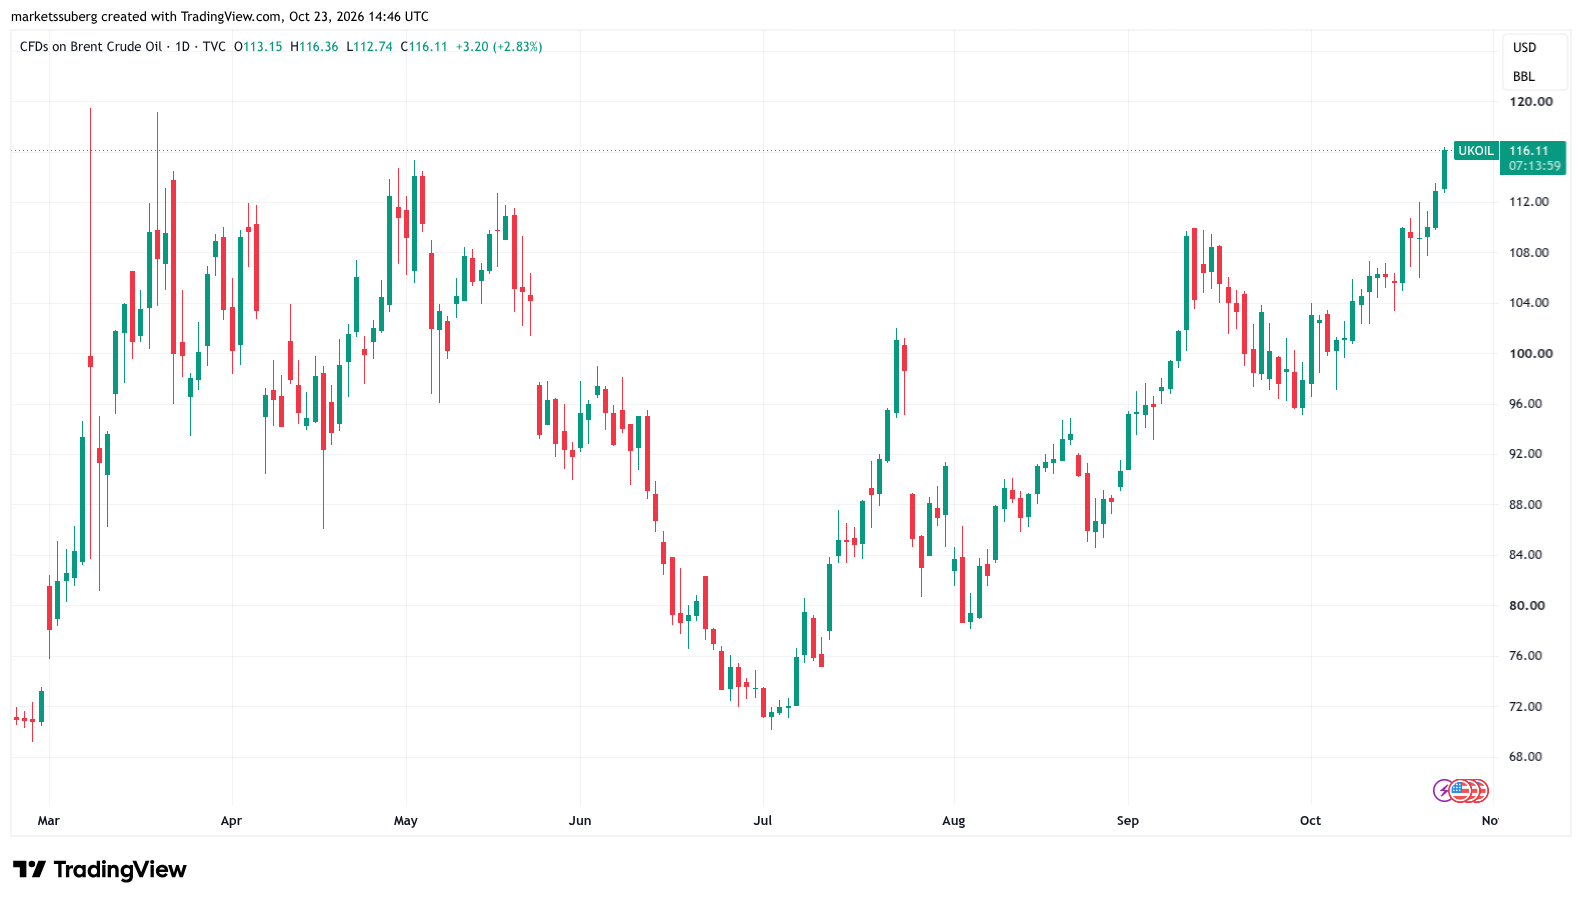
The primary catalyst for the day’s market-wide anxiety, however, stemmed from the commodities sector. Growing concerns that the United States might renew military strikes on Iran around the upcoming midterm elections sent West Texas Intermediate (WTI) crude oil surging past $102 per barrel on Friday, reaching its highest valuation since September 16. Brent crude experienced an even sharper upward trajectory, climbing nearly 3% to hit $116 per barrel, a price point that had not been observed since mid-March.
The dramatic spike in oil prices drew skepticism and analysis from prominent market economists. Robin Brooks weighed in on the unusual market dynamics, highlighting a stark disconnect between physical supply realities and paper market pricing. Brooks pointed out that actual oil flows through the Persian Gulf had recovered significantly, approaching pre-war levels for numerous nations, with Saudi Arabia even managing to surpass its pre-war production and export averages.
In analytical commentary shared via Substack, Brooks remarked that market observers had not witnessed this kind of decoupling between prices and physical flows since the start of the conflict. He emphasized that financial markets were aggressively incorporating a massive risk premium into energy contracts, driven primarily by fears of future supply disruptions rather than any immediate, tangible shortage on the ground.
BTC Price Analysis Eyes 50-Day Trend Line
Against this volatile macroeconomic backdrop, cryptocurrency analysts began scrutinizing low-timeframe price charts to gauge the severity of Bitcoin’s pullback and identify potential support zones. Keith Alan, cofounder of the crypto trading platform Material Indicators, shared his perspective on the unfolding price action, warning market participants of the distinct possibility of lower support retests if current technical levels fail to hold.
Alan pointed out that BTC/USD had slipped beneath its crucial 50-day simple moving average (SMA), which stood at $81,781. At the time of his analysis, market bulls were actively attempting to defend this key technical indicator and reclaim it by the time the daily candle closed.
Writing to his followers on the social media platform X, Alan outlined the potential downside scenarios should the defense fall short. He noted that if buyers failed to secure a daily close above the 50-day SMA, he would be actively looking for a deeper support test within the $78,000 to $80,000 price range.
This technical outlook aligns with broader on-chain data observations regarding historical accumulation zones. Previous market reports highlighted a substantial cluster of BTC price support situated strictly between the $80,000 and $81,500 range. This specific geographical band on the order book holds significant psychological and financial weight because it represents the aggregate cost basis for investors who acquired their holdings through spot Bitcoin exchange-traded funds (ETFs).
As the daily trading session progressed, the interaction between macroeconomic headwinds, traditional stock market weakness, and key cryptocurrency technical levels remained the central focus for market participants. Whether the spot ETF cost basis and the broader $80,000 support zone can withstand the renewed external pressures will largely depend on how geopolitical developments unfold and whether risk sentiment stabilizes in the sessions ahead.





Comments (0)