


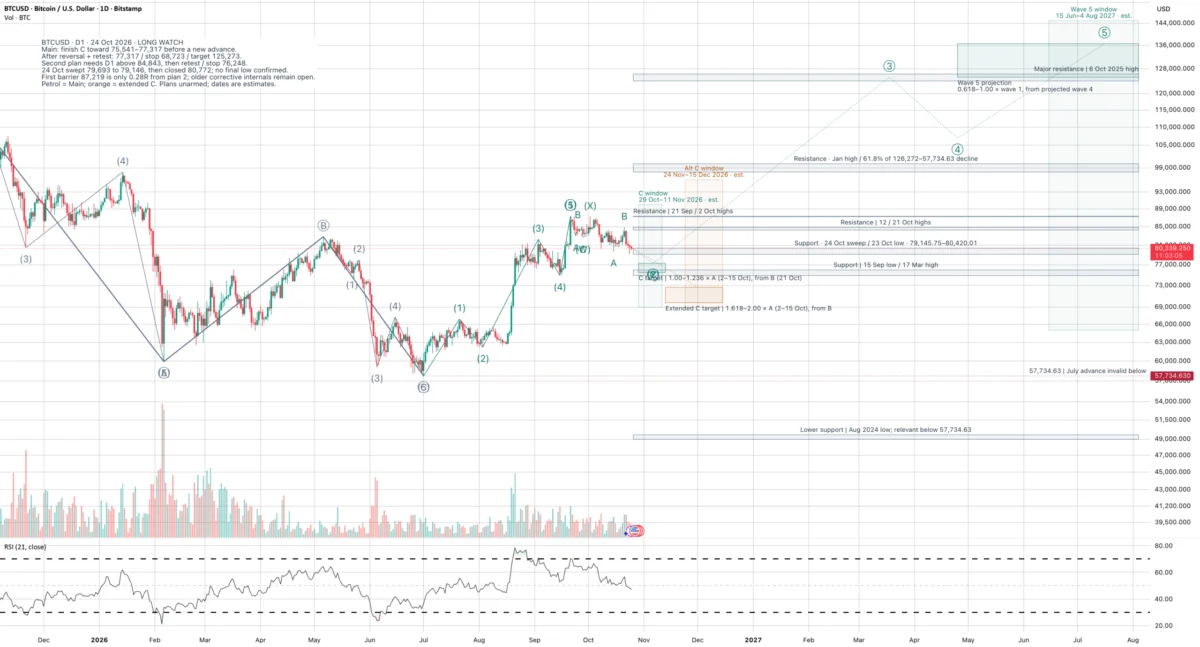
Bitcoin has decisively lost the pivotal 83,500 to 84,500 price corridor that had been the focal point of market discussions since September, introducing a new phase of technical uncertainty for traders and analysts tracking the spot market on Bitstamp. The latest completed daily candle, finalized on October 24, delivered a sharp sweep beneath the low established on October 15 before staging a notable recovery to close the session at 80,771.95 USD. While that intraday resilience and subsequent recovery are drawing close attention from technical market participants across the board, they do not yet provide definitive confirmation that the current corrective phase has run its course. As trading activity presses forward, the unfolding price action continues to test the resolve of market bulls while framing a complex roadmap for the weeks and months ahead.
Where the Current Correction Fits Within the Broader Cycle
To understand the weight of the current market movements, it is necessary to examine how this pullback fits into the broader structural count that spans several years. The larger Elliott Wave sequence under consideration begins deep in the bear market at the November 2022 cyclical low of 15,479 USD, tracking the subsequent multi-year advance up to the striking milestone high of 126,272 USD recorded in October 2025. Following that peak, the subsequent downside price action is treated as a standard ABC correction that found a provisional ending point at the July 2026 low of 57,734.63 USD.
The ensuing recovery rally from that July low up to September’s peak of 87,373.64 USD is interpreted as the proposed first wave of a brand-new overarching advance. However, the current primary second wave is actively being tracked as a complex intermediate W-X-Y correction, with the latest minor A-B-C decline unfolding internally as part of wave Y. Older connecting waves and various smaller internal subdivisions remain unresolved, highlighting the fluid nature of the current setup. Market observers emphasize that this count serves as a working technical interpretation rather than an absolute guarantee that another massive bull leg must inevitably follow.
Main Scenario: Allowing Wave C to Find Its Natural Finish
Within the primary analytical framework, the immediate focus centers on letting wave C complete its downward trajectory. A prominent teal target zone spanning from 75,541 to 77,317 USD projects 1.00 to 1.236 times the length of wave A, measured downward from the October 2 high of 87,219.40 USD to the October 15 low of 79,693.84 USD, extending from the October 21 wave B high of 84,842.65 USD. This projected Fibonacci-based zone conveniently overlaps with nearby historical support resting between 74,913 and 76,013 USD, creating a confluence of technical interest where buyers are expected to evaluate risk.
Meanwhile, the 79,146 to 80,420 USD band represents the immediate support test for the cryptocurrency. While a technical bounce originating from this band could potentially delay the realization of the lower target zone, establishing a final, tradeable low still requires concrete supporting market evidence rather than mere hope. The disciplined long-term trading plan demands a fully completed decline, a clear market reversal, and a subsequent successful retest of broken levels before capital deployment is seriously entertained. Under this disciplined approach, executing a limit entry around the 77,317 USD mark would only become worth considering once those prerequisites are met, as merely touching a Fibonacci support zone in isolation is not deemed sufficient confirmation.
The broader swing plan currently under consideration maps out a protective stop loss positioned firmly at 68,723 USD alongside a conditional third-wave upside objective near 125,273 USD. This setup offers approximately 5.58R before factoring in trading costs, with the distant objective calculated by projecting 1.618 times the July-to-September advance upward from the assumed second-wave low. Analysts note that any variation in the actual low ultimately established will alter this mathematical projection.
On the path toward that distant objective, however, several notable overhead obstacles stand in the way. Initial resistance is pegged between 84,254 and 84,843 USD, which sits roughly at 0.81R to its lower boundary. Higher up, additional hurdles loom between 87,219 and 87,374 USD, as well as a more formidable resistance band stretching from 97,939 to 100,091 USD. The existence of the high-flying long-term target does not erase or bypass these immediate structural roadblocks.
Alternative Scenarios and Deeper Correction Paths
While the primary thesis anticipates a relatively contained completion of wave C, market participants remain mindful of alternative possibilities. An orange alternative path allows wave C to extend downward in a more aggressive fashion toward the 69,792 to 72,666 USD range. This alternative applies a 1.618 to 2.00 extension of the same initial wave A measured from wave B, fundamentally shifting the depth and timing of the correction rather than banking on an immediate, near-term bullish reversal. It is worth noting, however, that the broader interpretation of the July advance would be entirely invalidated if prices drop below the critical floor of 57,734.63 USD; thus, a nearer-term trade stop does not automatically invalidate every possible larger-degree count.
A secondary long route becomes structurally relevant if the digital asset instead manages to establish a decisive recovery above 84,842.65 USD and successfully holds a subsequent retest of that level. The mapped parameters for this specific alternative feature an entry at 84,843 USD, a protective stop at 76,248 USD, and a target identical to the primary plan at 125,273 USD, yielding approximately 4.70R before costs.
Nevertheless, this alternative carries a serious technical qualification. The heavy overhead resistance zone beginning at 87,219 USD lies only about 0.28R above that proposed entry point. Consequently, analysts point out that they would need to witness convincing, sustained strength cutting cleanly through that formidable barrier—rather than simply a temporary breakout print on the ticker—before treating the larger overarching target as a viable and actionable trade plan.
Time Windows, Not Hard Deadlines
To help structure these competing projections without falling into the trap of rigid calendar forecasting, technical charts have outlined specific time windows rather than strict deadlines. The primary window for wave C to complete is marked between October 29 and November 11, while an extended C-wave path pushes that timeframe out into a secondary window running from November 24 through December 15.
Looking further ahead, a hypothesized fifth-wave window spanning from June 15 to August 4, 2027, remains entirely contingent upon the successful realization of an intermediate third-wave advance and a subsequent fourth-wave correction—both of which do not yet physically exist on the price charts. Ultimately, these time windows serve merely to organize the distinct analytical scenarios, leaving the final validation strictly in the hands of developing price structures.
This comprehensive technical evaluation is based on spot market data from the Bitstamp exchange, utilizing the daily USD chart with completed bars accounted for through October 24. With both primary and alternative long plans remaining inactive and the open daily candle withholding confirmation of a definitive low, the market continues to tread carefully at a critical historical juncture.

Comments (0)