


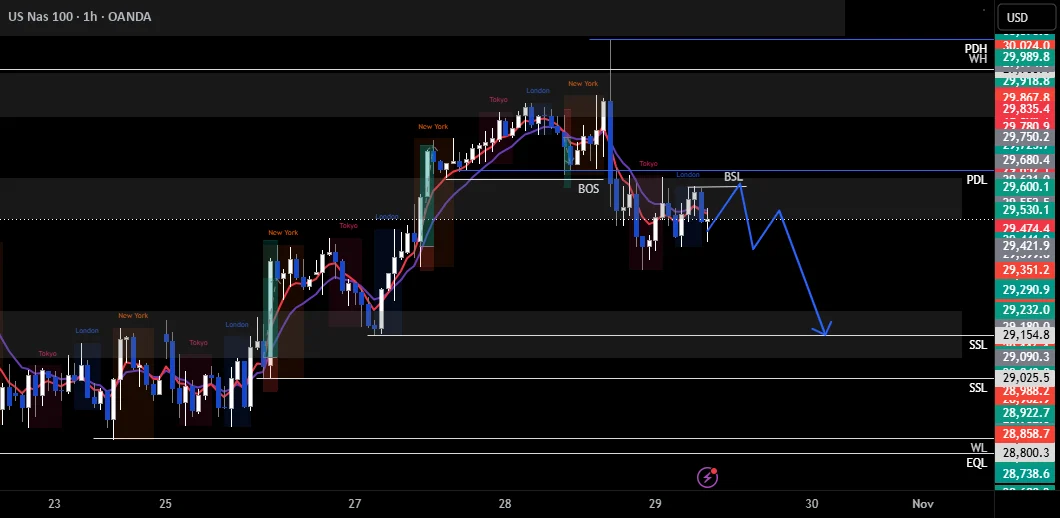
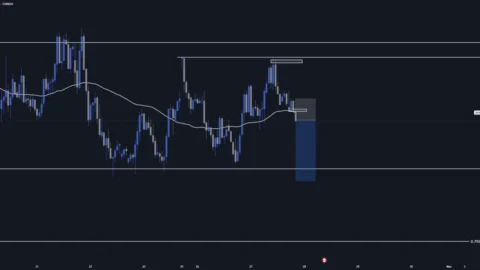
The analysis highlights a clear alignment between the four-hour and one-hour charts, both of which now reflect a dominant downward trend. In technical analysis, when higher timeframes such as the four-hour chart dictate a bearish regime, intraday traders typically look for continuation patterns that align with the overarching market direction. The recent shift on the one-hour timeframe has provided market participants with the localized confirmation needed to anticipate further downward movement in the upcoming trading sessions.
To capitalize on this prevailing trend, market participants are paying close attention to specific price action markers, notably internal buy-side liquidity (BSL) sweeps. In modern order-flow and liquidity-based trading concepts, a buy-side liquidity sweep occurs when price moves temporarily higher to clear out stop-loss orders or breakout buy orders resting above recent swing highs or internal resistance levels. These movements frequently act as trap mechanisms or optimal entry zones for institutional participants looking to re-establish short positions at more favorable prices.

Following such internal liquidity sweeps, technical analysts look for a swift change of character on lower timeframes, specifically ranging from the one-minute to the five-minute charts. This localized bearish market structure shift serves as the primary trigger for execution. Once the lower timeframe confirms that selling pressure has resumed and sellers have taken control of the immediate order flow, traders typically set their sights on lower sell-side liquidity (SSL) objectives. These sell-side liquidity pools generally reside beneath recent swing lows, equal lows, or prominent support zones where resting sell stops and institutional targets are frequently clustered.
The current technical configuration of the Nasdaq 100 CFD and associated futures contracts underscores the delicate balance between macroeconomic sentiment and technical positioning in major equity indices. As market participants navigate ongoing volatility, the interplay between multi-timeframe trend alignment and liquidity hunts remains a central focus for active traders assessing the direction of the US tech sector.
As is standard across major financial analysis platforms, observers emphasize that technical assessments of this nature represent individual market perspectives rather than definitive forecasts. Trading platforms and market commentators consistently remind participants that technical setups are subject to sudden shifts based on macroeconomic data releases, shifting monetary policy expectations, and broader global financial market developments. Consequently, risk management remains an essential component for any market participant analyzing potential short or long exposures within equity index derivatives.
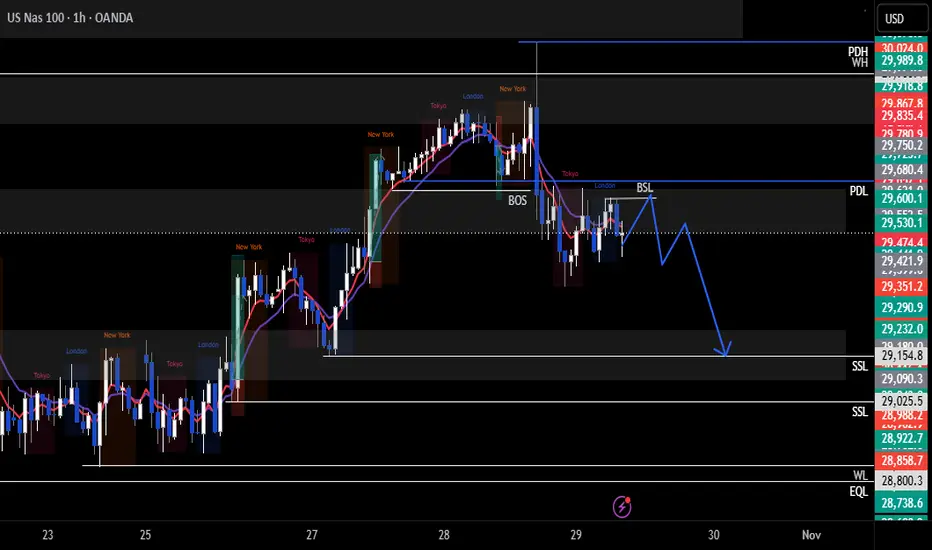
The ongoing developments in the Nasdaq 100 will continue to attract significant attention from retail and institutional traders alike as the index interacts with key liquidity zones and tests localized structural boundaries in the sessions ahead.

Comments (0)