


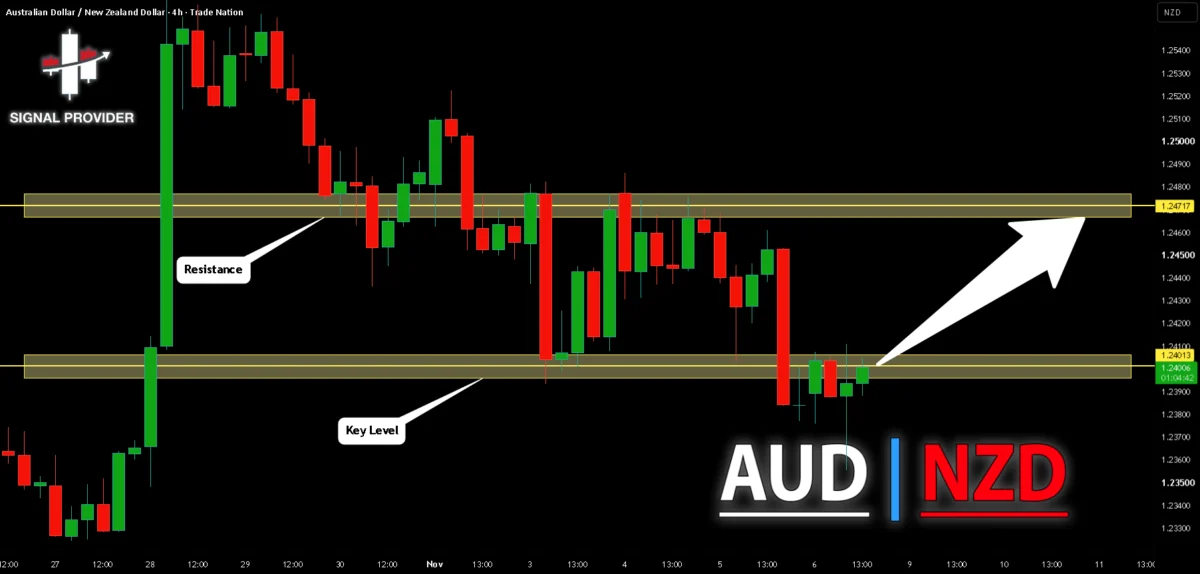
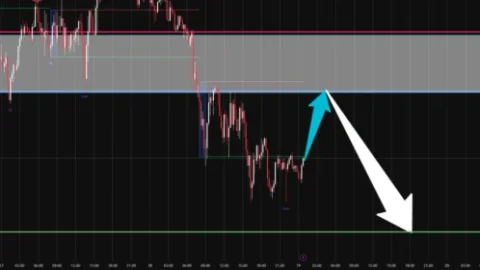
Foreign exchange market participants closely monitoring the Oceania currency cross are turning their attention toward the AUD/NZD pair as it navigates a crucial technical juncture on the four-hour time frame. Current price action highlights a prevailing bullish trend structure that continues to shape market sentiment, drawing focus toward a significant horizontal resistance barrier situated at the 1.240 level. Technical analysts reviewing the recent chart configurations note that the market’s ongoing interaction with this specific threshold could dictate the near-term directional bias for the currency pair, particularly as short-term momentum indicators reflect specific cyclical conditions.
The broader framework for the AUD/NZD pair on the 4-hour chart remains firmly rooted in an upward trajectory. Market participants observing the price action have identified higher swing lows and consistent attempts to challenge overhead supply zones as primary markers of the ongoing bullish persistence. This macro-structure provides the foundation for the current market outlook, suggesting that buyers retain underlying control of the medium-term trend despite periodic consolidations and localized selling pressure.
Adding nuance to the current technical setup is the reading provided by the short-term 7-period Relative Strength Index (RSI). Recent calculations indicate that the currency pair is currently exhibiting oversold characteristics based on this specific momentum oscillator. In standard technical analysis, an oversold RSI reading typically highlights moments where rapid downward price fluctuations or prolonged consolidation phases have temporarily stretched prevailing momentum relative to recent price ranges. However, experienced market observers maintain a balanced perspective regarding these specific indicator readings, keeping broader market dynamics in mind.
A key operational consideration emphasized by market commentators is that an oversold or overbought condition within a technical indicator can persist for extended periods during active market trends. Consequently, the presence of an oversold reading on a 7-period RSI does not automatically signal that an immediate price rally is imminent, nor does it guarantee a bullish reversal will materialize in the immediate future. Instead, market participants often utilize these readings as contextual data points rather than isolated triggers, weighing them carefully against underlying price structures, volume considerations, and broader support and resistance levels.

As the session progresses, the immediate focus centers squarely on the market’s approach to the critical horizontal level positioned at 1.240. Horizontal levels of this nature often attract significant algorithmic and discretionary trading interest, serving as psychological and technical demarcation lines where supply and demand dynamics frequently intensify. The way the market behaves upon testing this specific threshold is expected to provide valuable clues regarding the strength of the prevailing buyers and the willingness of sellers to defend the overhead supply zone.
Considering today’s active price action and the structural alignment of the 4-hour chart, market probabilities appear tilted toward the possibility of a continued upward movement targeting the 1.247 level, provided the current bullish momentum maintains its integrity and successfully negotiates the initial 1.240 hurdle. Such a movement would represent a continuation of the established trend framework, aligning short-term price fluctuations with the broader directional bias observed across the 4-hour time horizon.
As market participants continue to engage with these developments, ongoing monitoring of volume, candlestick formations, and real-time reaction at the 1.240 level will remain essential for assessing the validity of the projected movement toward 1.247.
Disclaimer
The information and publications provided through these market analyses are not meant to be, and do not constitute, financial, investment, trading, or other types of advice or recommendations supplied or endorsed by TradingView or associated market commentators. Market participants are encouraged to conduct their own comprehensive research and risk assessments before engaging in any financial transactions or trading activities.

Comments (0)