


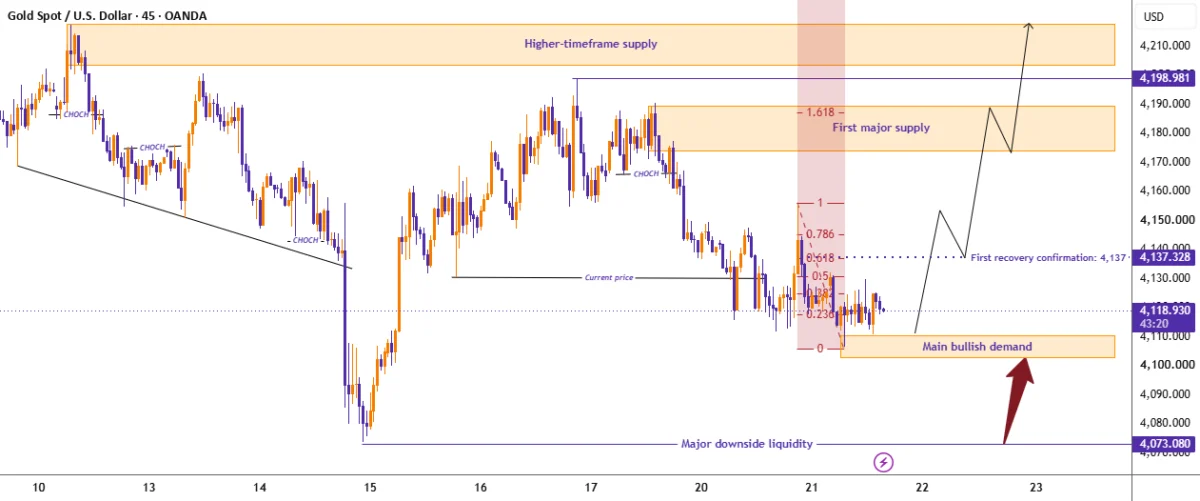
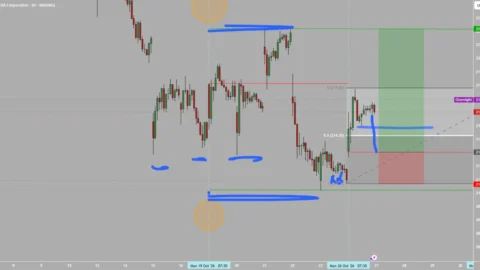
Gold is trading near 4,121, consolidating just above an important demand zone between 4,103 and 4,110 following several sessions of persistent bearish pressure. The latest market developments on the M45 chart reveal a fascinating tug-of-war between market participants. While sellers have successfully maintained control through a sequence of lower highs and downward structural movements, the recent descent is visibly losing momentum near a crucial support base.
Market observers note that buyers are actively attempting to defend this area. Concurrently, Fibonacci projections highlight a potential recovery path pointing toward the 4,175 to 4,190 range, with an extended trajectory eventually targeting 4,203 to 4,217. However, simply reaching support does not confirm an automatic market reversal. Analysts emphasize that gold must first reclaim the 4,137 and 4,155 price thresholds to demonstrate a meaningful and lasting bullish shift.
The central question facing traders and market analysts alike is whether the 4,103 level is genuinely establishing a solid foundation for a new recovery wave, or if sellers are merely pausing before preparing another liquidity sweep aimed at 4,073.
Smart Money Concepts and the Structural Battle
The recent price action reflects a clear bearish sequence, characterized by sellers repeatedly defending lower highs and effectively preventing any sustained bullish continuation. Several internal Change of Character formations have materialized on the charts, yet buyers have consistently struggled to convert these short-term shifts into a confirmed bullish Break of Structure.
Gold is currently consolidating around the 4,120 mark, hovering immediately above the primary demand zone. Within this environment, three specific structural developments demand close attention from market participants.
The 4,103 to 4,110 range serves as the main demand base and represents the primary potential liquidity sweep area. This zone acts as the first major decision point for the precious metal. Should gold experience a brief dip below recent lows, successfully absorb the prevailing selling pressure, and quickly reclaim the support level, it could signal a classic liquidity sweep. A subsequent bullish Change of Character following that reaction would provide significantly stronger evidence of committed buyer participation.
Moving higher, the 4,137 to 4,155 region functions as the recovery confirmation area. Reclaiming 4,137 would indicate an improvement in short-term bullish momentum. However, a more definitive breakout above 4,155, followed by a successful retest of that level, would offer convincing evidence that the immediate bearish market structure is fundamentally altering.
Beyond that lies the first major supply zone between 4,175 and 4,190. This represents the initial significant upside obstacle for any recovery effort. The area is dense with potential selling interest and neatly overlaps with the 1.618 Fibonacci expansion target. If prices advance into this zone and subsequently print a bearish Change of Character, another corrective decline could easily develop. Technical analysts frequently remind market participants that while a liquidity sweep can trigger a recovery, confirmed structural transitions require both Change of Character and Break of Structure validations.
Fibonacci Projections and Potential Recovery Targets
Fibonacci analytical tools further illustrate the potential recovery trajectory rising from the current support base. The analytical framework outlines several key milestones, beginning with the baseline recovery support at 4,103, moving through initial reaction levels at 4,115 and 4,23, and touching short-term equilibrium around 4,129.
Further up, the 0.618 Fibonacci retracement level sits at 4,137, marking the first recovery confirmation threshold. Intermediate resistance appears near 4,145, leading up to the important recovery threshold at 1.000, which corresponds to 4,155. Finally, the extended bullish target rests at the 1.618 projection near 4,188. While these figures represent approximate readings derived directly from chart configurations, they provide a structured roadmap for potential price behavior.
The most compelling technical confluence emerges between 4,175 and 4,190. In this narrow band, the first major supply zone directly intersects with the 1.618 Fibonacci projection. This structural overlap is widely expected to attract considerable profit-taking alongside fresh selling pressure.
Nevertheless, if aggressive buyers manage to decisively push through the 4,190 mark and successfully reclaim the 4,199 resistance level, attention will quickly shift toward the higher-timeframe supply zone situated between 4,203 and 4,217. Market veterans caution that Fibonacci projections merely outline potential paths rather than guaranteeing that the market will ultimately reach those destinations.
Key Price Zones and Strategic Market Levels
Navigating the current market landscape requires keeping a close eye on several critical price boundaries. With the spot price hovering around 4,121, the overarching structure remains delicately balanced.
The primary bullish demand zone rests firmly between 4,103 and 4,110. On the upside, the first recovery confirmation is pegged at 4,137, followed closely by intermediate resistance spanning 4,145 to 4,155. The first major supply barrier is established at 4,175 to 4,190, with secondary resistance located at 4,199. Beyond these lies the higher-timeframe supply zone stretching from 4,203 to 4,217.
Conversely, major downside liquidity is concentrated around the 4,073 mark. Sustained bullish confirmation remains dependent on a decisive move above 4,155, while the primary risk of bearish continuation looms should prices slip below the 4,103 support floor.
Evaluating Potential Trading and Market Scenarios
Market participants are currently weighing multiple operational scenarios depending on how price action unfolds across these key technical zones.
A primary buying scenario centers on a reaction at the demand zone following a liquidity sweep. In this setup, traders look for gold to successfully defend the 4,103 to 4,110 range and exhibit convincing bullish rejection. A sweep beneath recent lows, quickly followed by bullish displacement and a Change of Character, would significantly strengthen the case for a recovery toward initial targets at 4,137, 4,155, and eventually the 4,175 to 4,190 band, while maintaining a stop-loss protection level below 4,090. Analysts stress that buying simply because a price has dropped into a demand zone is insufficient; concrete confirmation remains essential.
An alternative buying approach involves waiting for the broader bullish structure to be fully reclaimed. This scenario requires buyers to push prices above 4,155 following a confirmed breakout and successful retest, targeting subsequent zones at 4,175, 4,188 to 4,190, and the higher 4,203 to 4,217 resistance area, with risk managed below 4,137. This pathway relies on buyers maintaining robust momentum and establishing a clear bullish Break of Structure to confirm the continuation toward extended Fibonacci extensions.
On the sell side, a primary bearish scenario could materialize around the 4,175 to 4,190 supply zone if gold reaches the area but fails to sustain its upward momentum. A liquidity sweep followed by a bearish Change of Character and renewed selling displacement would validate a corrective pullback toward 4,155, 4,137, and the 4,103 to 4,110 support base, using a stop-loss above 4,200. However, if prices break and hold firmly above 4,190, market participants are advised to reassess the higher resistance zone at 4,203 to 4,217 rather than prematurely banking on an immediate rejection.
A more aggressive breakdown scenario would trigger if the main demand base fails entirely. An entry below 4,103 following a confirmed breakdown and a failed retest of the support could pave the way toward downside targets at 4,090 and the major liquidity pool at 4,073, with risk defined above 4,120. Such a move would confirm that sellers retain absolute control over the market structure.
Broader Market Outlook and Perspectives
The prevailing view among market analysts highlights that while gold is actively attempting to stabilize near a vital demand area, the broader M45 structure remains fundamentally bearish until buyers can furnish undeniable proof of a structural shift.
Smart Money Concepts dictate that repeated lower highs continue to reflect ongoing seller dominance, meaning a liquidity sweep accompanied by a bullish Change of Character and Break of Structure is vital to improve the recovery outlook. Simultaneously, Fibonacci analysis points to the 0.618 retracement level near 4,137 as the initial hurdle, with the 1.618 expansion target near 4,188 aligning neatly with overhead supply.
Ultimately, the 4,103 support base serves as the immediate battleground, with 4,073 acting as the ultimate downside reference point. The preferred recovery narrative involves gold successfully defending the 4,103 to 4,110 zone, reclaiming the 4,137 to 4,155 threshold, and launching a corrective advance toward the 4,175 to 4,190 resistance band. Should momentum persist above that initial supply zone, the upper boundary between 4,203 and 4,217 comes into play. Conversely, a confirmed breach below 4,103 would dismantle the bullish recovery narrative and redirect immediate focus back toward 4,073.
As traders debate the path forward, the underlying technical lesson remains clear: Fibonacci projections illustrate where price has the potential to travel, but Smart Money Concepts dictate whether buyers have genuinely earned the right to take it there.

Comments (0)