


Bitcoin (BTC) is currently facing a delicate technical and on-chain inflection point as recent market participants slide into an aggregate loss. Fresh analytics indicate that the premier cryptocurrency is at risk of converting a historically crucial support level into a stubborn overhead ceiling. As price action hovers below key moving averages and realized price bands, market observers are closely monitoring whether short-term speculators will trigger further downside volatility or if the market can successfully reclaim its footing.
The core of the current market anxiety stems from shifting dynamics among speculative traders who entered the ecosystem over the past several months. According to comprehensive data provided by the on-chain analytics platform CryptoQuant, Bitcoin is now trading comfortably beneath the realized price—frequently referred to as the aggregate cost basis—of investors who accumulated their holdings between one and three months ago.
Bitcoin’s $77,700 Cost Basis Could Become Resistance
Within the architecture of on-chain market analysis, this specific cohort of participants is widely classified as speculative traders. Because their time preference is short-term, these market participants tend to exhibit heightened sensitivity to immediate price fluctuations and macroeconomic volatility. During robust bull market phases, the aggregate cost basis of these traders has historically functioned as a reliable, upward-sloping foundation of support, repeatedly catching dips and propelling prices higher.
However, market mechanics dictate that a structural shift occurs when spot prices decisively breach these critical levels to the downside. Analysts warn that when Bitcoin drops below this threshold, the exact same cost basis can flip roles, subsequently acting as a formidable resistance barrier. This behavioral shift happens because newly "underwater" traders—those holding positions at an unrealized loss—frequently view any subsequent price recovery back toward their breakeven point as an ideal tactical window to exit the market and neutralize their exposure.
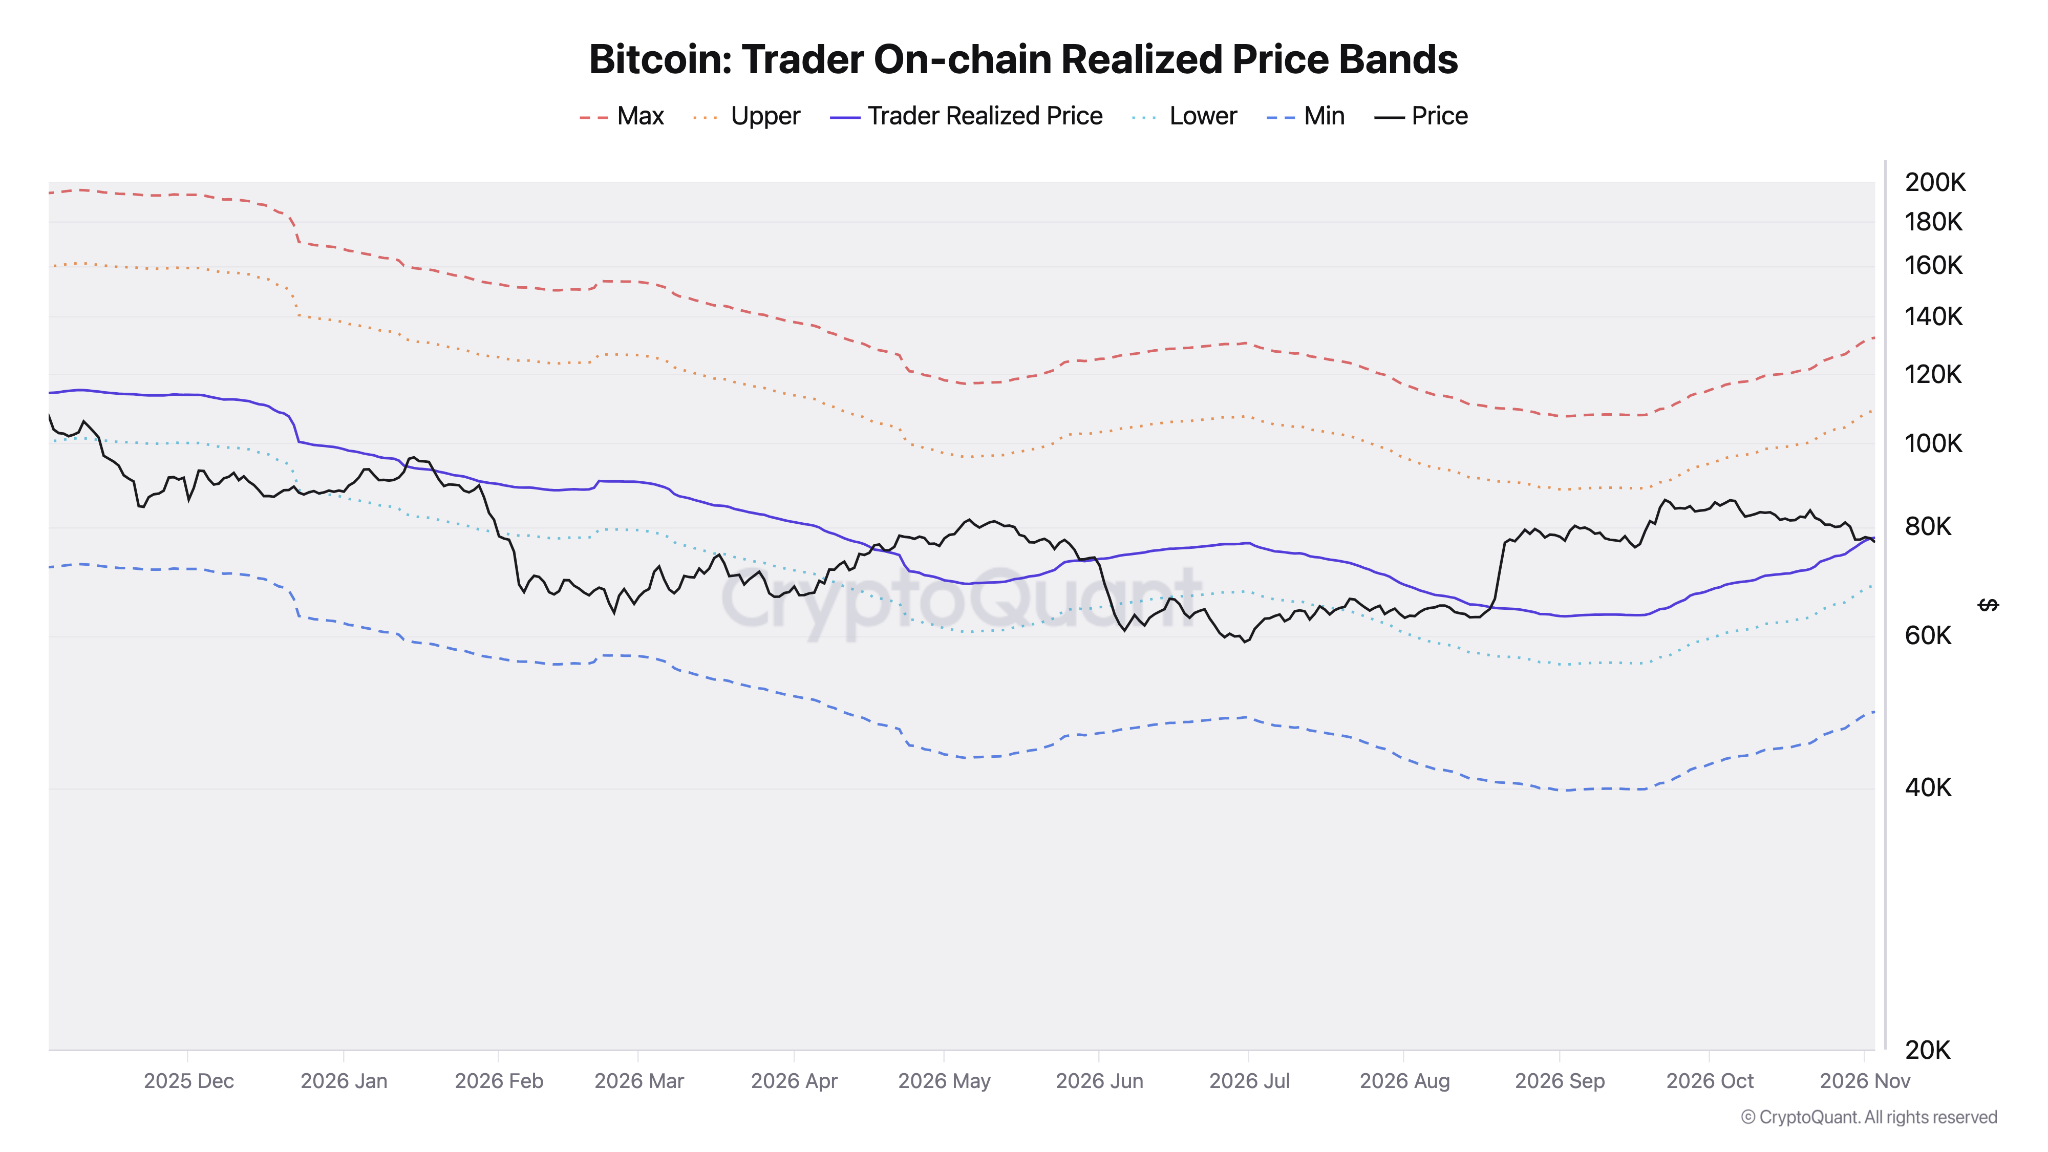
As outlined in recent CryptoQuant analysis, this critical trader cost basis—measured through the platform’s Trader Onchain Realized Price Bands metric—currently sits at $77,700. In comparison, spot BTC/USD exchange rates have been trading around the $76,500 mark, leaving the asset stranded just beneath this vital psychological and financial threshold.
Another notable phenomenon highlighted by on-chain researchers is the behavior of the Trader Realized Price itself while the broader market undergoes a correction. Rather than moving sideways or dropping in tandem with spot prices, the Trader Realized Price has maintained a steady upward trajectory. Consequently, the structural gap between the actual market price and the aggregate cost basis of these short-term participants has narrowed significantly, increasing the pressure on current holders.
The broader price bands surrounding this metric incorporate upper and lower trailing levels established at fixed profit and loss percentage margins. Historical data shows that BTC/USD fell beneath the Trader Onchain Realized Price after maintaining positions above it since August 19. Looking downward, the nearest support band situated below the primary cost basis corresponds to a 12% aggregate loss for this cohort, placing that safety net at approximately $68,400. The last time Bitcoin pierced through this lower band was at the very beginning of June, a move that was followed by an extended downward deviation reaching up to 12.6% below the band over the subsequent month before buyers eventually engineered a recovery.
Bitcoin Short-Term Holders Watch Profits Erode
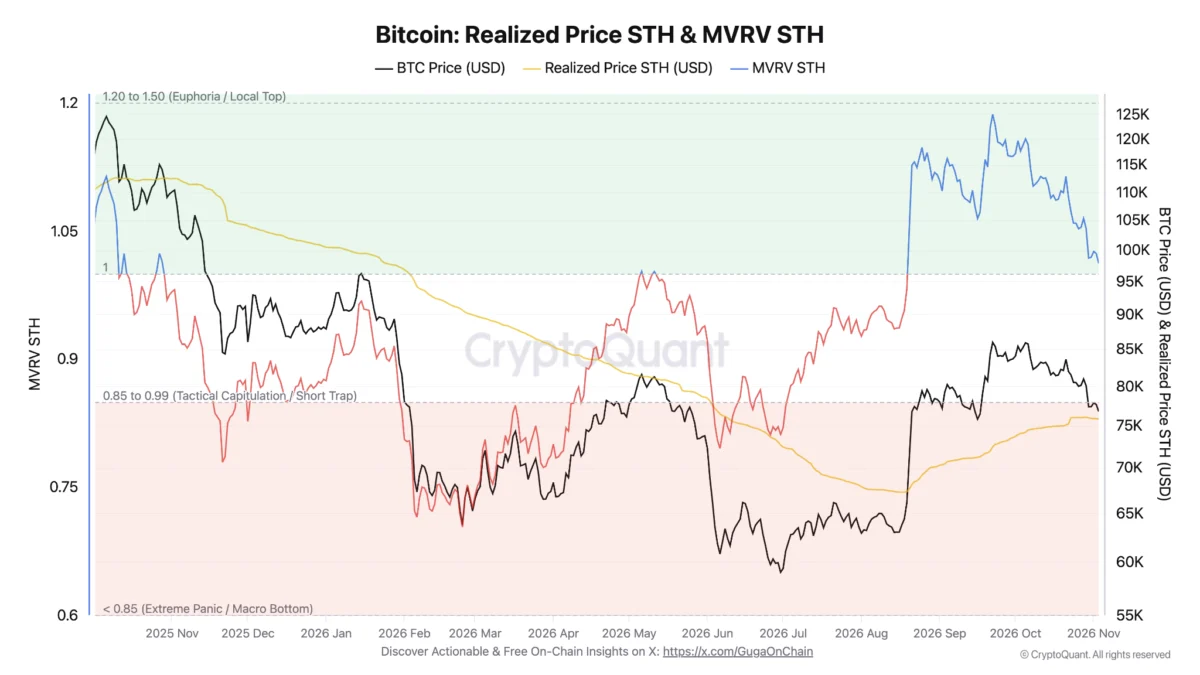
Beyond the one-to-three-month cohort, Bitcoin is also rapidly approaching the realized price threshold governing the broader base of speculative market participants known universally as short-term holders (STHs). This broader category encompasses any entity that has retained possession of their Bitcoin supply without moving it on-chain for a period of up to 155 days. Much like the narrower trader bands, the STH realized price functions as a dynamic trend line that typically provides robust support during sustained upward trends, yet aggressively flips into stiff resistance when the market experiences a macro downtrend reversal.
As of recent data readings, these short-term entities maintain an aggregate cost basis situated at $75,832. This localized cost basis directly corresponds to a reading of 1.012 on the cohort’s Market Value to Realized Value (MVRV) ratio. For context, the MVRV metric is calculated by dividing the total market value of all short-term holder coins by their aggregate realized value, utilizing the exact prices at which those specific tokens were last transacted on-chain.
Market historians and on-chain analysts pay close attention to the MVRV ratio of short-term holders because it provides deep insight into market psychology and capitulation risk. When the spot price drifts downward and breaches the breakeven point corresponding to the STH realized price—pushing the MVRV ratio below 1.0—the market enters a sensitive zone. According to historical models, once this breakdown occurs, the next major psychological support target typically aligns with an MVRV reading of 0.85.
Within analytical circles, this specific 0.85 MVRV region is frequently characterized as an area of "tactical capitulation" or a potential "short trap." It represents a zone where panic selling by inexperienced or over-leveraged market participants often reaches a localized climax, frequently flushing out weak hands before a more durable market bottom can be established.
The last instance in which BTC/USD slipped through this crucial 0.85 MVRV threshold occurred during the early summer drawdown in June. During that period, the market tested lower bounds before gradually repairing market structure and reclaiming those levels in mid-August, setting the stage for subsequent upside momentum that is now being tested once again. As market participants navigate these precarious on-chain metrics, the coming days will likely determine whether Bitcoin can successfully defend these realized price baselines or if the market is destined for a deeper retracement toward established historical support zones.





Comments (0)