


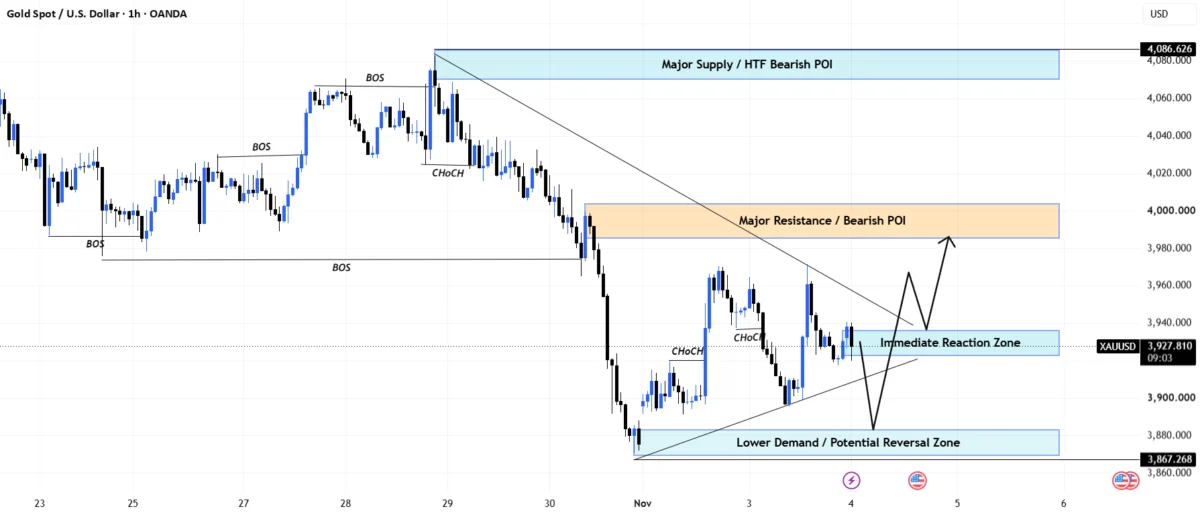
Gold prices are currently trading around the $3,924 mark, consolidating near an important hourly (H1) reaction area after failing to sustain their previous recovery attempts. The precious metal is facing persistent headwinds as market participants weigh a challenging macroeconomic backdrop marked by shifting monetary policy expectations and broader financial market dynamics.
The overarching macro environment remains decidedly difficult for non-yielding bullion. A firmer U.S. dollar, rising Treasury yields, and surprisingly resilient labor market data are keeping expectations elevated regarding potential Federal Reserve tightening through December. This combination of strong macroeconomic indicators and hawkish monetary policy expectations is capping the strength of gold’s recovery, even as the market stages intermittent attempts to stabilize following recent sell-offs.
Technical View
From a structural standpoint, the broader H1 timeframe remains firmly bearish. This bearish bias was cemented following a clear Change of Character (CHoCH) originating from the 4,08x region, which was subsequently followed by aggressive downside price displacement.
Despite this prevailing downward momentum, price action is currently compressing around the immediate reaction zone spanning from 3,918 to 3,936. At the same time, a rising lower trendline continues to provide a degree of short-term structural support, preventing an immediate and unmitigated collapse.
Current chart projections suggest that the market favors one deeper liquidity move before any meaningful upward retracement can materialize. The strongest concentration of support below current levels sits within the 3,868 to 3,883 lower demand and potential reversal zone, which is located directly above the crucial 3,867.268 structural low. Should market buyers successfully defend this lower zone, the technical structure would allow for a corrective recovery toward upper resistance levels.
Key Market Zones
To navigate the current market landscape, traders and analysts are closely monitoring several distinct technical boundaries. The major supply and higher-timeframe bearish Point of Interest (POI) is firmly established between 4,068 and 4,086. Just below that, the 3,984 to 4,004 range serves as a major resistance area and another significant bearish POI.
Closer to current market prices, the 3,918 to 3,936 zone functions as the immediate reaction area where price is currently compressing. Looking lower, the critical 3,868 to 3,883 range represents the lower demand and potential reversal zone, resting just above the vital structural low point at 3,867.268.
Trading Plan and Market Outlook
Given the prevailing technical structure, the primary trading priority favors initiating long positions only after a lower liquidity test has occurred. Rather than chasing the current price action around the 3,924 level, the preferred market scenario involves allowing gold to drift below the current reaction structure to thoroughly test the 3,868 to 3,883 lower demand zone.
The ideal market condition requires a decisive liquidity sweep into this lower demand area, followed immediately by clear H1 bullish confirmation. If buyers respond robustly to this test, the initial recovery objective targets the 3,950 to 3,965 area. A controlled pullback from that region would remain acceptable to market participants, provided that the underlying higher-low structure is fully protected.
Following such a pullback, the main corrective upside objective shifts toward the 3,984 to 4,004 major resistance and bearish POI zone. The projected sequence of events envisions initial weakness in the 3,918 to 3,936 region, leading into a liquidity test at 3,868 to 3,883, accompanied by bullish confirmation, which would ultimately pave the way for a corrective recovery toward the 3,984 to 4,004 resistance band.
Important Considerations and Risk Management
Analysts emphasize that because the broader trend remains inherently bearish, this entire setup represents a corrective recovery rather than the confirmation of a full bullish reversal. A sustained H1 breakdown below the 3,867.268 structural low would completely invalidate the recovery thesis, confirming instead a continuation of downside price expansion.
On the upside, the 3,984 to 4,004 range remains a formidable bearish POI. Any future recovery pushing into that zone must be carefully reassessed by market participants rather than automatically treated as a signal for trend continuation.
The buy-side perspective remains strictly conditional on a verified reaction from the 3,868 to 3,883 area. The strongest opportunity relies on the market testing lower demand, demonstrating that sellers lack the momentum to sustain downward pressure below the structural low, and subsequently confirming active buyer participation.
Ultimately, gold maintains a bearish stance on the broader H1 structure, yet price action is steadily approaching a critical zone where downside momentum could experience temporary exhaustion. The defining level for the near term remains the 3,868 to 3,883 lower demand zone. If buyers step in to defend this area following a comprehensive liquidity sweep, the technical charts point toward a corrective recovery moving through the 3,918 to 3,936 threshold, followed by a larger advance toward the 3,984 to 4,004 major resistance. For the time being, the strategy remains straightforward: lower demand first, technical confirmation second, and a measured recovery toward resistance third.

Comments (0)