


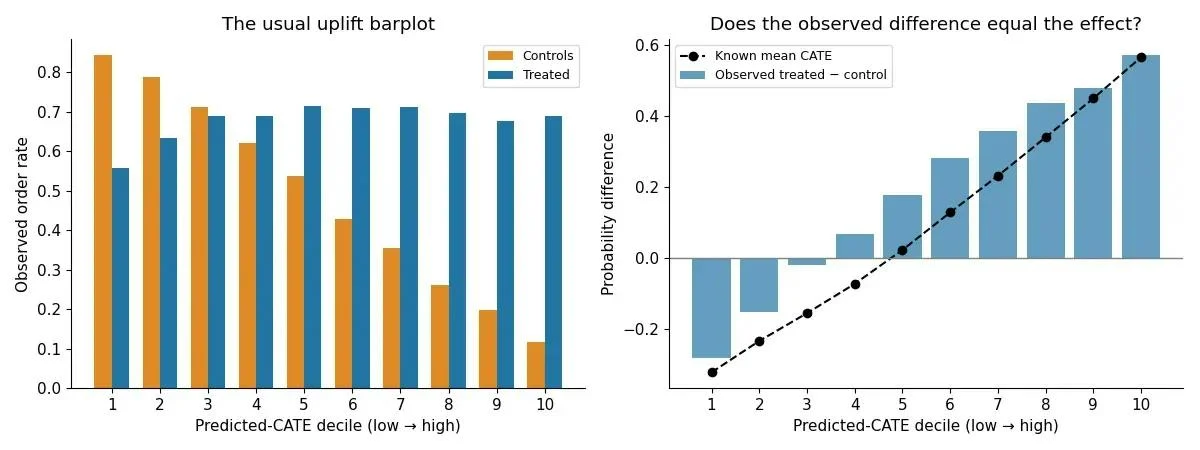
Data scientists and machine learning engineers relying on standard uplift metrics to evaluate customer targeting models may be inadvertently choosing flawed strategies, according to a recent simulation-based analysis. The research demonstrates that popular tools like the Qini metric can easily rank imperfect causal models above the true treatment-effect ranking, leading businesses to select communication policies with lower true causal gains.

The core of the problem lies in a disconnect between causal estimation and causal evaluation. While modern causal machine learning algorithms are designed to account for confounding variables—such as when customer characteristics dictate whether they receive a marketing message—the metrics traditionally used to evaluate these models often fail to make the same adjustments. Consequently, evaluation metrics like the Qini curve can still harbor selection bias, distorting qualitative conclusions and model comparisons.

The Targeting Question and the Illusion of Balanced Groups
In a standard marketing scenario, a company must decide which customers should receive promotional messages to maximize conversions. The optimal approach relies on estimating the Conditional Average Treatment Effect (CATE) for each individual. High CATE scores indicate that a specific customer profile will yield a significantly higher uplift in purchase probability if contacted, compared to receiving no message at all. Because marketing budgets are inherently limited, an accurate ranking of customers by their true CATE is instrumental for efficient budget allocation.

To investigate how different evaluation frameworks handle this challenge, researchers simulated a dataset of one million individual customer profiles incorporating variables such as age, income, past spending habits, and the time elapsed since their last contact. A factual communication policy was then established, ensuring that assignment probabilities depended directly on customer characteristics like age and inactivity.

While the simulation maintained balanced treatment group sizes overall—assigning roughly 50 percent of the population to treatment—selective assignment heavily influenced individual probabilities. When evaluating models on this data, researchers examined six common causal estimators, ranging from S-learners to Double Machine Learning (DML) learners, implemented using both linear frameworks and gradient-boosted base models.

From Uplift Bars to the Qini Curve and Its Pitfalls
The most intuitive way practitioners inspect uplift without knowing the ground truth is through uplift barplots, where customers are sorted by predicted CATE into buckets to observe treatment versus control outcomes. While these visualizations appear informative, the observed differences inside each bucket do not reflect true causal effects because grouping by predicted CATE does not guarantee that treated and control customers within the same bucket share comparable characteristics.

To obtain a single summary number for model comparison, data scientists frequently turn to the Qini area under the curve (AUC), which cumulates positive outcomes for treatment and control groups as customers are added sequentially by predicted value. However, the simulation revealed a critical flaw: the Qini metric evaluates models using observed treatments and outcomes directly. Because the underlying data contains selection bias due to targeted assignments, the resulting metric remains fundamentally confounded.

In the comparative analysis, a calibrated Qini metric systematically favored certain imperfect models—such as the Linear Doubly Robust learner—over the oracle true-CATE ranking. This discovery highlights a profound risk in causal machine learning: improving the causal learner is insufficient if the evaluation metric itself remains observational and biased.

Adjusting Evaluation with Inverse Propensity Weighting and Doubly Robust Scores
To overcome the limitations of traditional metrics, evaluators must adjust for confounding during the assessment phase. The study highlights two primary adjustments: Inverse Propensity Weighting (IPW) and Doubly Robust (DR) scoring. IPW assigns weights to observed outcomes based on the inverse probability of how likely a customer’s specific treatment assignment was, effectively reweighting the sample to correct for selection bias.

Doubly Robust scoring takes this a step further by combining propensity weights with outcome predictions and residuals. Even if the underlying models encounter estimation errors, DR scoring provides a more resilient evaluation framework. When applied to the six boosted learners in the study, IPW and DR scores aligned closely with known causal gains from the synthetic dataset, successfully favoring the true-CATE ranking over flawed alternatives.

However, researchers caution that these advanced scoring methods are not silver bullets. IPW requires a correctly specified propensity model, while DR scoring relies on either a correct propensity model or accurate outcome models. Furthermore, all estimators and evaluators depend on foundational causal assumptions including consistency, no unmeasured confounding, and overlap.

Robustness, Hyperparameter Tuning, and Practical Takeaways
To verify whether these model comparisons were statistically robust, the researchers conducted one thousand paired bootstrap resamples on the holdout datasets. Evaluating the conditional confidence intervals revealed that while advanced evaluators like DR scores maintained stable behavior across different assignment policies with varying degrees of selectivity, the Qini metric fluctuated wildly. Changes in selection bias heavily distorted Qini’s outputs, confirming its susceptibility to observational confounding.

Additional testing involving hyperparameter tuning across fifteen configurations for each boosted learner demonstrated that tuning did not alter the fundamental ranking distortions seen in confounded metrics like Qini. While tuning improved specific learners such as the T-learner, it had negligible or even negative impacts on others like the S-learner, reinforcing the view that simpler estimation structures can sometimes match or outperform more complex alternatives depending on the application context.

For practitioners navigating causal model selection, the findings offer a clear directive. When working with non-randomized observational data—which encompasses the vast majority of real-world business environments—standard uplift plots and Qini curves should be approached with extreme caution. Instead, organizations should adopt evaluation designs and scoring methods like Doubly Robust evaluation that account for underlying selection mechanisms. Ultimately, while area-under-the-curve metrics provide useful diagnostics, optimization efforts should remain anchored to core business objectives such as budget constraints, marketing costs, and net incremental value.




Comments (0)